
Market Week: January 9, 2023
The Markets (as of market close January 6, 2023)
Last Friday’s rally helped drive stocks higher to end the first full week of January. Investors apparently saw
a deceleration in November and December average hourly earnings (see jobs report below) as a sign that
the aggressive monetary policy followed by the Federal Reserve may actually be slowing inflation. Traders
will await this week’s consumer price index to get a better gauge on the direction of inflationary pressures.
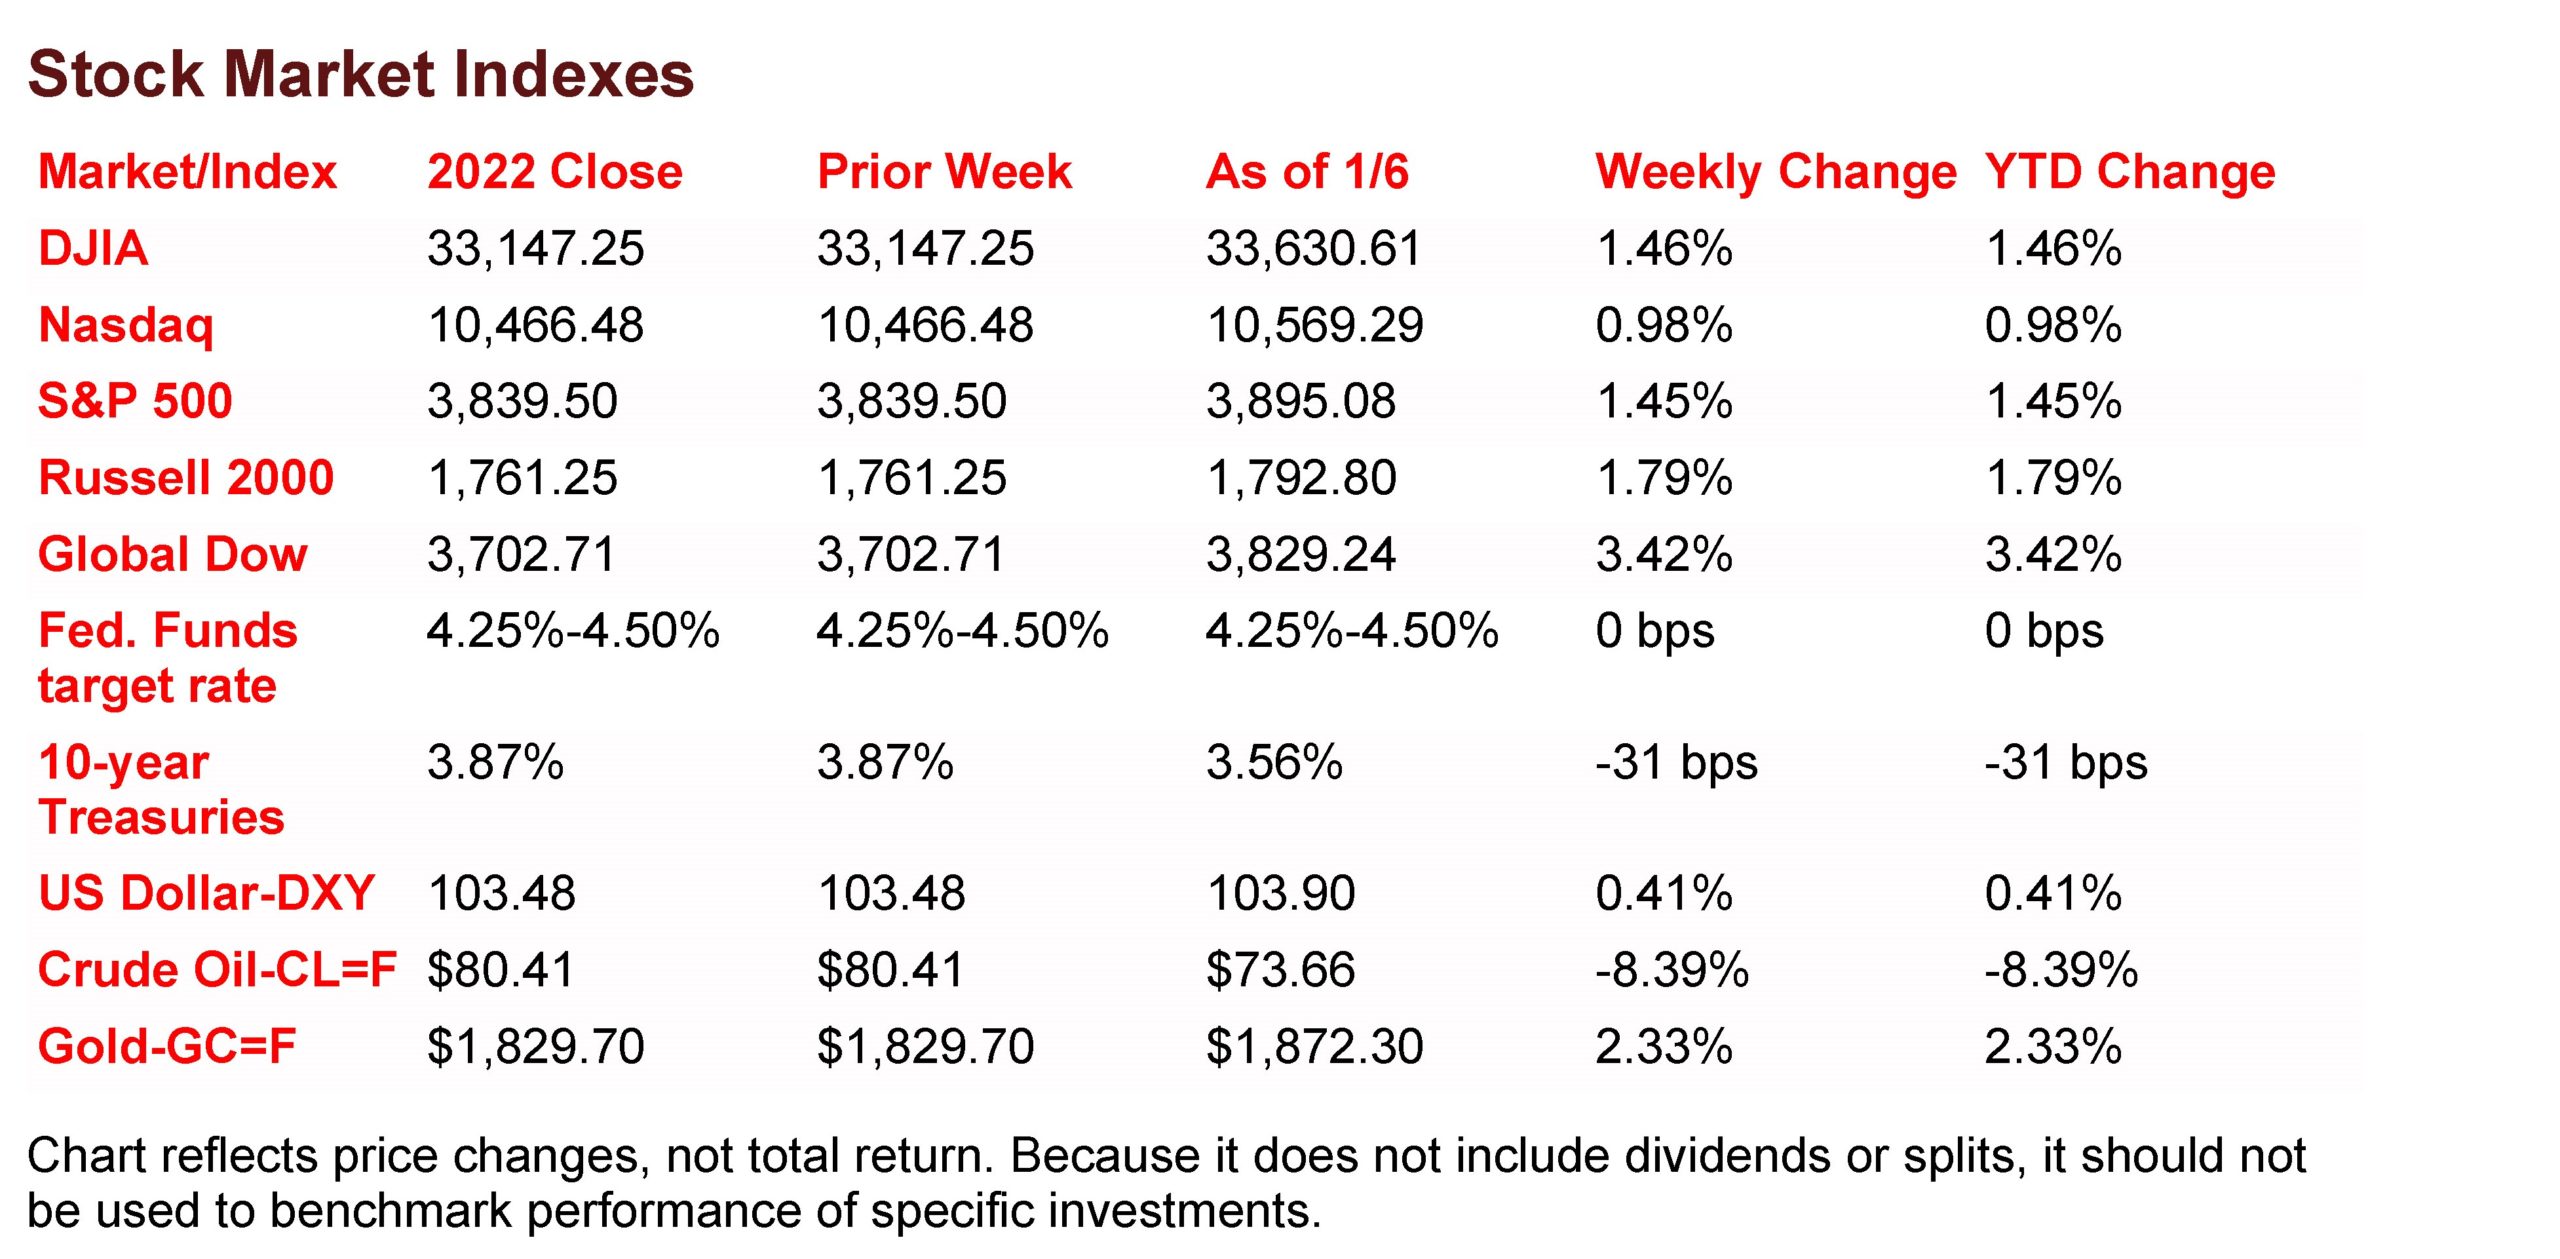
Nevertheless, stocks closed last week higher, led by the Global Dow. The large caps of the Dow and the
S&P 500 boasted solid gains, as did the small caps of the Russell 2000. Ten-year Treasury yields fell on
rising bond prices. Crude oil prices declined nearly $7.00 per barrel. The dollar rose marginally, while gold
prices advanced.
Stocks finished the first trading session of 2023 lower. Wall Street was closed last Monday in observance of
New Year’s day. However, investors weren’t in a spending mood last Tuesday, particularly with respect to
megacap stocks. The Nasdaq continued its 2022 downward spiral, declining 0.8%. The Russell 2000 slid
0.6%, the S&P 500 lost 0.4%, while the Dow ended the day flat. The Global Dow was able to eke out a
0.2% gain. Bond prices rose, driving the yield on 10-year Treasuries down 8.6 basis points to 3.79%. The
dollar advanced the most in nearly three weeks, while gold prices reached their highest values since
mid-June. Crude oil prices lost nearly 4.0%, falling to $77.15 per barrel.
Wall Street snapped a two-day losing streak last Wednesday. The Global Dow led the benchmark indexes
listed here, gaining 1.4%, followed by the S&P 500 (0.8%), the Nasdaq (0.7%), the Russell 2000 (0.6%),
and the Dow (0.4%). Ten-year Treasury yields fell 8.4 basis points, closing at 3.70%, as long-term bond
values rose for the second consecutive day. Weakening demand sent crude oil prices lower to $73.24 per
barrel. The dollar slipped lower, while gold prices notched a second consecutive strong performance.
Stocks ended last Thursday’s session lower as investors grappled with the prospect of another strong labor
report, due out the following day. The Federal Reserve has focused, in part, on the strength of the labor
sector. A strong December jobs report would likely give the Fed room to keep up its aggressive policy
aimed at stemming rising inflation. Among the indexes listed here, the Nasdaq fell the furthest, losing 1.5%,
followed by the S&P 500 (-1.2%), the Russell 2000 (-1.1%), the Dow (-1.0%), and the Global Dow (-0.5%).
Ten-year Treasury yields inched up to 3.72%. The dollar added nearly 0.9%, while gold prices fell 1.1%.
Crude oil prices rose less than $1.00 to close at about $73.75 per barrel.
Wall Street enjoyed its first major rally of 2023 last Friday. Each of the benchmark indexes listed here
gained more than 2.0%, led by the Nasdaq (2.6%), followed by the S&P 500 (2.3%), the Russell 2000 and
the Global Dow (2.2%), and the Dow (2.1%). Bond prices jumped higher, pulling yields lower. Ten-year
Treasury yields fell 15.1 basis points to close the week at 3.56%. Crude oil prices ended the day flat,
remaining at $73.66 per barrel. The dollar dipped lower, while gold prices recouped the prior day’s losses
after gaining 1.72%.
Last Week’s Economic News
Employment increased by 223,000 in December, according to the latest report from the Bureau of Labor
Statistics. It is worth noting that employment gains in October and November were revised lower to
263,000 (from 284,000) and 256,000 (from 263,000), respectively. Notable job gains occurred in leisure
and hospitality, health care, construction, and social assistance. Employment rose by 4.5 million in 2022
(an average monthly gain of 375,000), less than the increase of 6.7 million in 2021 (an average monthly
gain of 562,000). The unemployment rate edged down 0.1 percentage point to 3.5%. The
unemployment rate has remained within a range of 3.5%-3.7% since March. The number of unemployed
persons decreased by 278,000 to 5.7 million. The employment-population ratio increased by 0.2
percentage point over the month to 60.1%. The labor force participation rate edged up 0.1 percentage
point to 62.3%. Both measures have shown little net change since early 2022. In December, average
hourly earnings rose by $0.09, or 0.3%, to $32.82. Over the past 12 months ended in December,
average hourly earnings have increased by 4.6%, which is lower than the 12-month increase from
November 2021 (5.1%). The average work week decreased by 0.1 hour in December to 34.3 hours.
Wages have decelerated in November and December, which could be a sign that inflation is easing.
However, statistically, there are nearly two available jobs for every unemployed person, so job growth is
likely to continue.
According to the latest information from the Census Bureau, the international trade in goods and
services deficit was $61.5 billion in November, $16.3 billion less than the October deficit. The November
trade deficit was the lowest since July 2020. November exports were $251.9 billion, $5.1 billion less than
October exports. November imports were $313.4 billion, $21.5 billion less than October imports. Overall,
the November decline in both imports and exports may indicate weakening domestic and foreign
demand entering the holiday shopping season. Year to date, the goods and services deficit increased
$120.1 billion, or 15.7%, from the same period in 2021. Exports increased $439.4 billion, or 18.9%.
Imports increased $559.5 billion, or 18.1%.
The number of job openings was little changed at 10.5 million on the last business day of November,
according to the latest Job Openings and Labor Turnover report from the U.S. Bureau of Labor
Statistics. Over the month, the number of hires and total separations changed little at 6.1 million and 5.9
million, respectively. Within separations, quits, layoffs, and discharges changed little.
The results of the survey of purchasing managers revealed manufacturing declined at the fastest rate
since May 2020, and was one of the sharpest reductions since 2009. The S&P Global US Manufacturing
PMI™ was 46.2 in December, down from 47.7 in November. A reading of less than 50.0 indicates a
decrease in manufacturing. Survey respondents indicated that the decline stemmed from weak client
demand, which decreased new orders and output. Employment waned and backlogs of work fell
sharply. Companies noted that weak client demand stemmed from economic uncertainty and inflationary
pressures, leading to lower purchasing power among customers.
Business suffered a sharp decline in the services sector in December, according to the latest survey of
purchasing managers. The S&P Global US Services PMI Business Activity Index registered 44.7 in
December, down from 46.2 in November. The rate of decline in services output accelerated for the third month running and was the second-fastest since May 2020. Lower business activity was attributed to a
reduction in new orders, as client demand weakened due to the impact of higher interest rates and
inflation on customer spending.
Retail prices for regular gasoline rose for the first time in several weeks. According to the U.S. Energy
Administration, the national average retail price for regular gasoline was $3.223 per gallon on January 2,
$0.132 per gallon above the prior week’s price but $0.058 lower than a year ago. Also, as of January 2,
the East Coast price increased $0.139 to $3.210 per gallon; the Gulf Coast price rose $0.207 to $2.891
per gallon; the Midwest price climbed $0.151 to $3.050 per gallon; the West Coast price increased
$0.029 to $3.939 per gallon; and the Rocky Mountain price advanced $0.041 to $3.043 per gallon.
Residential heating oil prices averaged $4.663 per gallon on January 2, $0.025 above the previous
week’s price and $1.273 per gallon more than a year ago.
For the week ended December 31, there were 204,000 new claims for unemployment insurance, a
decrease of 19,000 from the previous week’s level, which was revised down by 2,000. According to the
Department of Labor, the advance rate for insured unemployment claims for the week ended December
24 was 1.2%, unchanged from the previous week’s rate. The advance number of those receiving
unemployment insurance benefits during the week ended December 24 was 1,694,000, a decrease of
24,000 from the previous week’s level, which was revised up by 8,000. States and territories with the
highest insured unemployment rates for the week ended December 17 were Alaska (2.3%), New Jersey
(2.1%), Minnesota (2.0%), California (1.9%), Puerto Rico (1.9%), Montana (1.8%), Massachusetts
(1.8%), Rhode Island (1.8%), New York (1.7%), and Washington (1.6%). The largest increases in initial
claims for unemployment insurance for the week ended December 24 were in Missouri (+4,974),
Kentucky (+4,133), Washington (+2,197), New York (+2,097), and Ohio (+2,026), while the largest
decreases were in California (-3,234), Georgia (-1,568), Texas (-1,455), Florida (-1,090), and North
Carolina (-888).
Eye on the Week Ahead
The first full week of 2023 kicks off with important inflationary data, with the release of the consumer price
index and the report on import and export prices. Inflation may be showing signs that it has peaked. The
CPI in November rose 0.1% and 7.1% from November 2021.
Key Dates/Data Releases
- 1/12: Consumer Price Index, Treasury budget statement
- 1/13: Import and export prices
Data sources: Economic: Based on data from U.S. Bureau of Labor Statistics (unemployment, inflation);
U.S. Department of Commerce (GDP, corporate profits, retail sales, housing); S&P/Case-Shiller 20-City
Composite Index (home prices); Institute for Supply Management (manufacturing/services). Performance:
Based on data reported in WSJ Market Data Center (indexes); U.S. Treasury (Treasury yields); U.S.
Energy Information Administration/Bloomberg.com Market Data (oil spot price, WTI, Cushing, OK);
www.goldprice.org (spot gold/silver); Oanda/FX Street (currency exchange rates). News items are based
on reports from multiple commonly available international news sources (i.e., wire services) and are
independently verified when necessary with secondary sources such as government agencies, corporate
press releases, or trade organizations. All information is based on sources deemed reliable, but no
warranty or guarantee is made as to its accuracy or completeness. Neither the information nor any opinion
expressed herein constitutes a solicitation for the purchase or sale of any securities, and should not be
relied on as financial advice. Forecasts are based on current conditions, subject to change, and may not
come to pass. U.S. Treasury securities are guaranteed by the federal government as to the timely payment
of principal and interest. The principal value of Treasury securities and other bonds fluctuates with market
conditions. Bonds are subject to inflation, interest-rate, and credit risks. As interest rates rise, bond prices
typically fall. A bond sold or redeemed prior to maturity may be subject to loss. Past performance is no
guarantee of future results. All investing involves risk, including the potential loss of principal, and there can
be no guarantee that any investing strategy will be successful.
The Dow Jones Industrial Average (DJIA) is a price-weighted index composed of 30 widely traded
blue-chip U.S. common stocks. The S&P 500 is a market-cap weighted index composed of the common
stocks of 500 largest, publicly traded companies in leading industries of the U.S. economy. The NASDAQ
Composite Index is a market-value weighted index of all common stocks listed on the NASDAQ stock
exchange. The Russell 2000 is a market-cap weighted index composed of 2,000 U.S. small-cap common
stocks. The Global Dow is an equally weighted index of 150 widely traded blue-chip common stocks
worldwide. The U.S. Dollar Index is a geometrically weighted index of the value of the U.S. dollar relative to
six foreign currencies. Market indexes listed are unmanaged and are not available for direct investment.
IMPORTANT DISCLOSURES
Broadridge Investor Communication Solutions, Inc. does not provide investment, tax, legal, or retirement advice or recommendations. The
information presented here is not specific to any individual’s personal circumstances. To the extent that this material concerns tax matters, it is
not intended or written to be used, and cannot be used, by a taxpayer for the purpose of avoiding penalties that may be imposed by law. Each
taxpayer should seek independent advice from a tax professional based on his or her individual circumstances. These materials are provided for
general information and educational purposes based upon publicly available information from sources believed to be reliable — we cannot assure
the accuracy or completeness of these materials. The information in these materials may change at any time and without notice.
