
Market Week: January 17, 2023
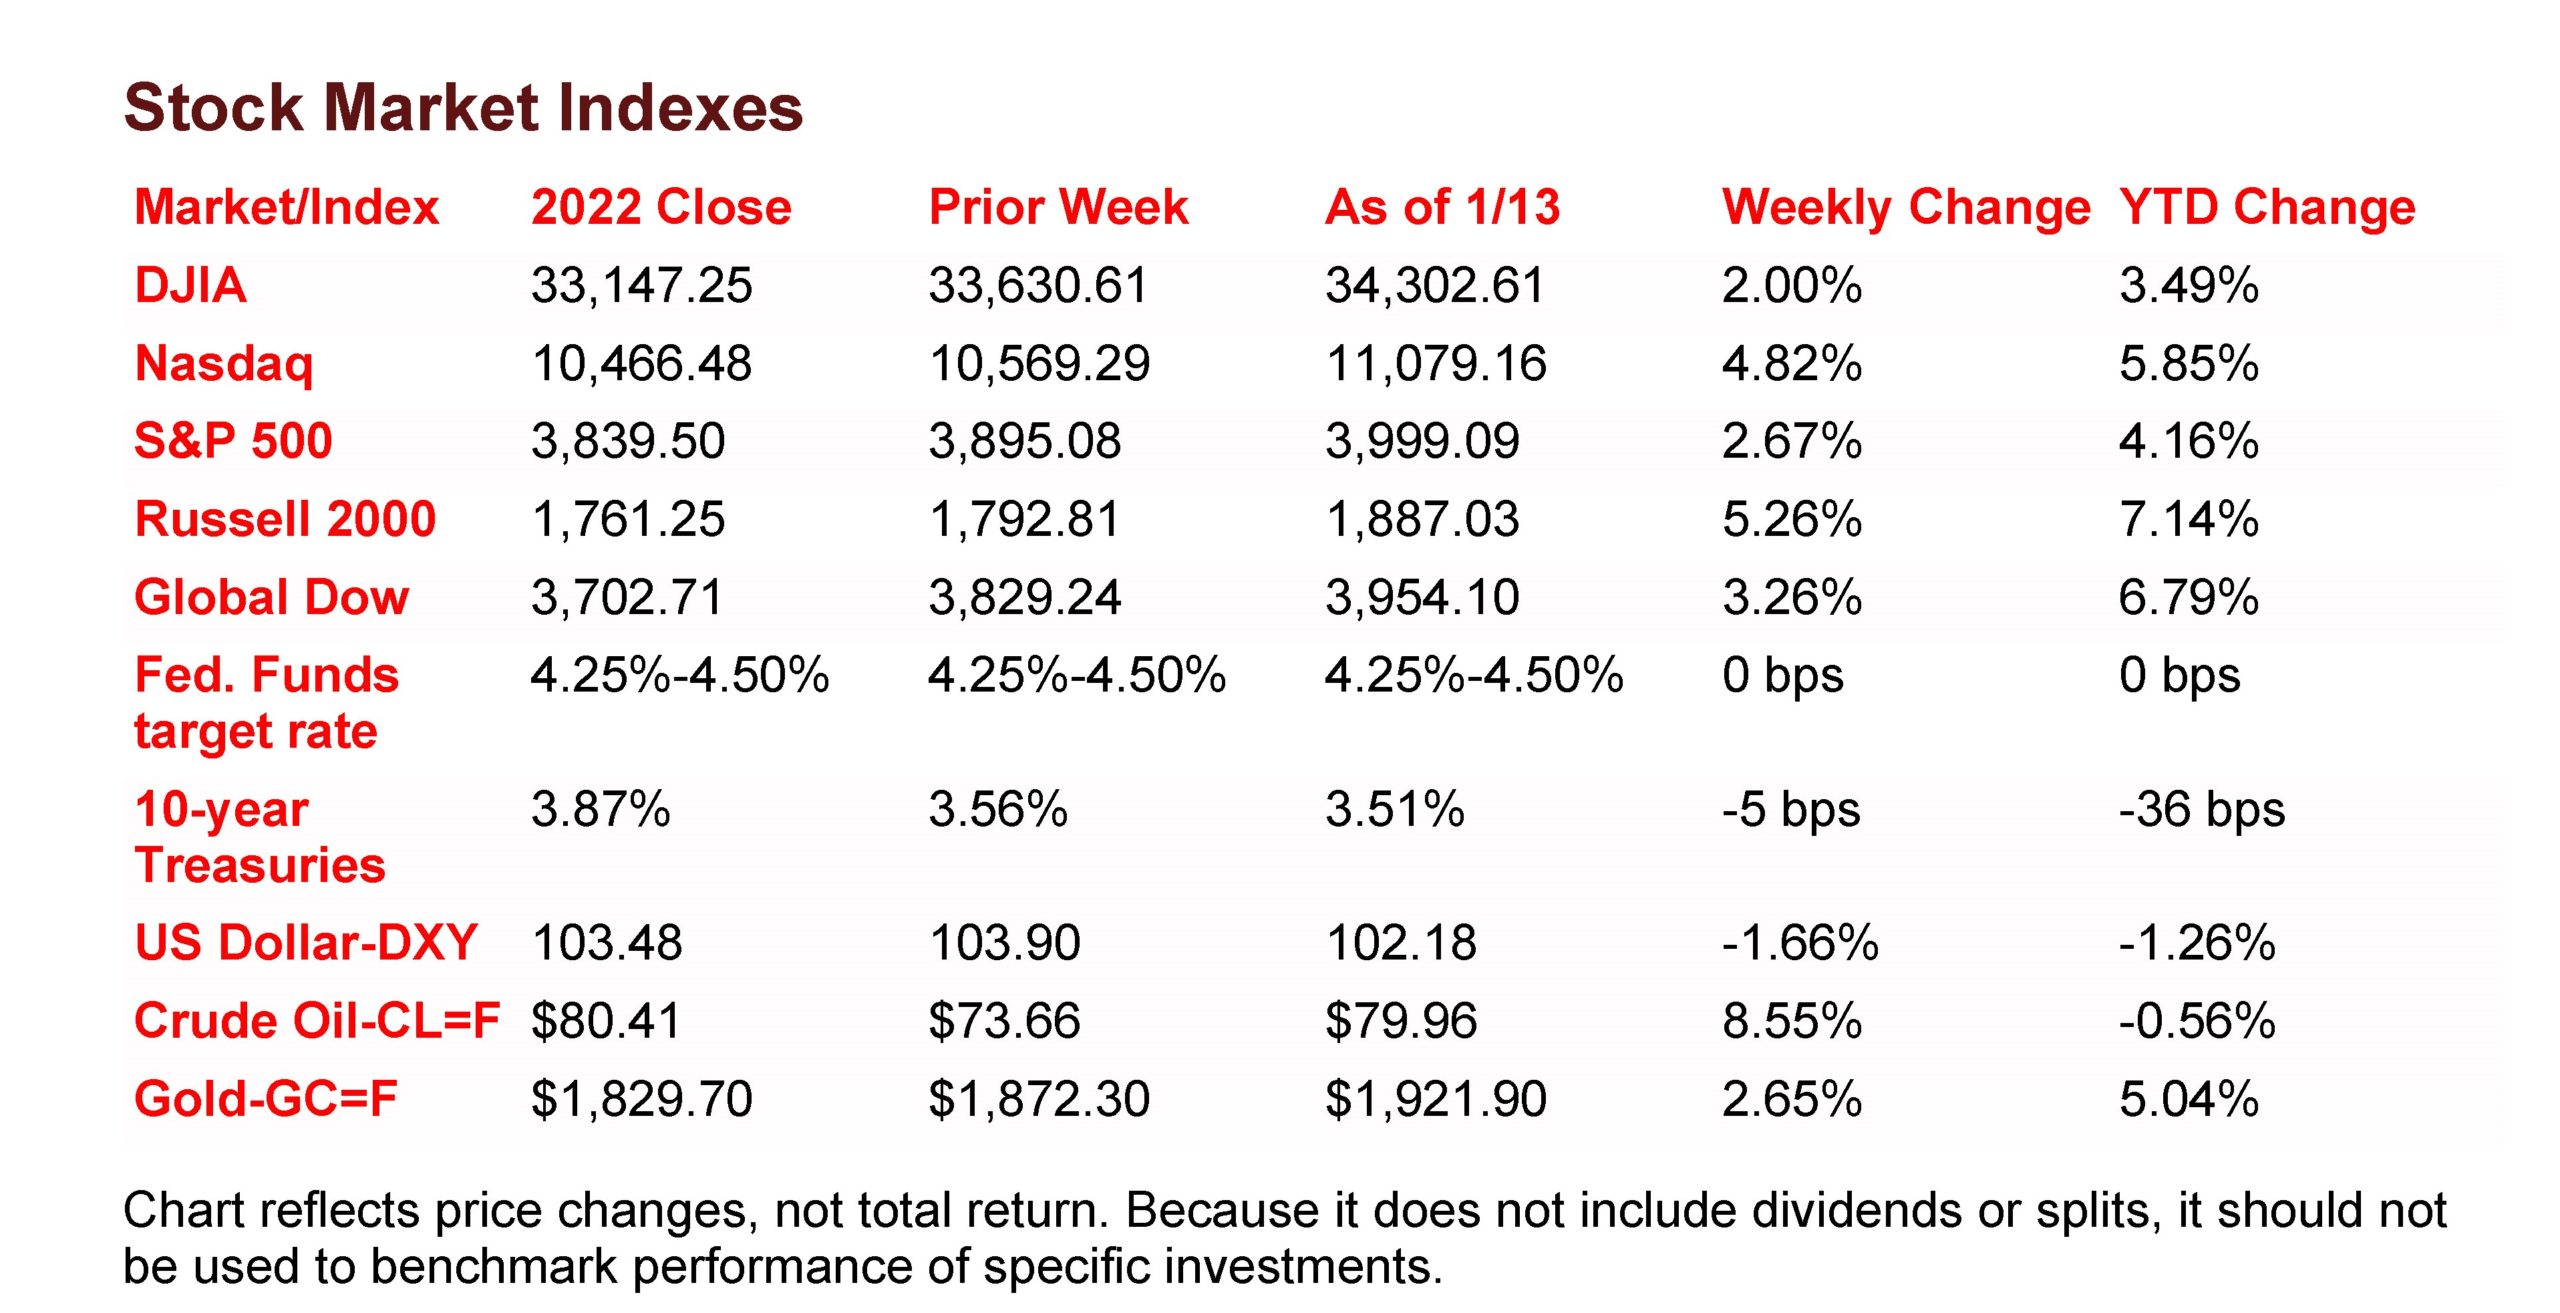
The Markets (as of market close January 13, 2023)
Stocks advanced for the second week in a row to kick off 2023. Investors were encouraged by inflation data
that showed prices slid lower in December. The interest-rate-sensitive Nasdaq posted gains for six
consecutive sessions, its longest streak since 2021, while the Nasdaq and the S&P 500 enjoyed their
biggest weekly gains in nearly two months. China’s economic reopening boosted prospects for increased
energy demand, sending crude oil prices higher. The dollar declined last week, which helped gold prices
surge to the highest level since April.
Last Monday saw stocks end the day with mixed results. Among the benchmark indexes listed here, the
Nasdaq and the Global Dow gained 0.6%, while the Russell 2000 advanced 0.2%. The large caps of the
Dow (-0.3%) and the S&P 500 (-0.1%) ended the session lower after trending up most of the day. Investors’
hopes for a softening of interest-rate hikes were dampened by a few Federal Reserve officials who
suggested that interest rates could hit 5.0%. Bond prices advanced pulling yields lower, with 10-year
Treasury yields falling 5.2 basis points to 3.51%. Crude oil prices rose to $74.81 per barrel. The dollar slid
lower, while gold prices rose more than a quarter of a percent to $1,875.70 per ounce.
Stocks jumped higher last Tuesday on hopes that the consumer price index for December will show further
softening, which could prompt the Federal Reserve to slow the pace of its interest-rate hikes. The Russell
2000 led the benchmark indexes, gaining 1.5%, followed by the Nasdaq (1.0%), the S&P 500 (0.7%), the
Dow (0.6%), and the Global Dow (0.2%). As stock values rose, bond prices fell, pushing yields higher, with
10-year Treasury yields adding 10.4 basis points to close at 3.62%. Crude oil prices changed little from the
previous day. The dollar and gold prices advanced.
Equities advanced last Wednesday for a second consecutive day as investors seemed to be betting that
inflation would continue to soften, strengthening the case for a Federal Reserve pullback on interest-rate
hikes. The Nasdaq led the benchmark indexes, gaining 1.8%. The S&P 500 jumped 1.35, followed by the
Russell 2000 (1.1%), the Dow (0.8%), and the Global Dow (0.7%). Ten-year Treasury yields fell 6.7 basis
points to 3.55%. Crude oil prices rose 3.4% to $77.65 per barrel, supported by expectations of stronger
demand from China. The dollar inched higher, while gold prices continued to rally, adding $4.10 per ounce
to reach $1,880.60 per ounce.
Not surprisingly, investors were encouraged after the release of the latest consumer price index (see
below). Stocks advanced for the third consecutive day last Thursday, led by the Russell 2000 (1.7%) and
the Global Dow (1.4%). The Dow and the Nasdaq rose 0.6%, while the S&P 500 gained 0.3%. Ten-year
Treasury yields fell 10.5 basis points to 3.44%. Crude oil prices rose to $78.34 per barrel. The dollar edged
lower, while gold prices climbed higher, hitting $1,900.80 per ounce.
Stocks continued their rally last Friday. The Nasdaq and the Global Dow gained 0.7%, while the Russell
2000 rose 0.6%, the S&P 500 advanced 0.4%, and the Dow climbed 0.3%. Ten-year Treasury yields added
6.2 basis points to close at 3.51%. Crude oil prices advanced $1.57 to reach $79.96 per barrel. The dollar
slipped for the second consecutive day, while gold prices vaulted up 1.3% to $1,921.90 per ounce.
 Last Week’s Economic News
Good news on the inflation front. The December consumer price index fell 0.1%. Excluding food and
energy, the CPI rose 0.3% last month. In December, prices for food rose 0.3% (0.5% in November),
energy prices fell 4.5% (-1.6% in November), while prices for shelter rose 0.8% (0.6% in November).
Over the last 12 months ended in December, the CPI has increased 6.5%, the smallest increase since
the period ended in October 2021. For the 12 months ended in December, core prices (less food and
energy) rose 5.7%, energy prices increased 7.3%, and food prices advanced 10.4%. All of these
increases were smaller than for the 12-month period ended in November.
Import prices rose 0.4% in December after declining 0.6% in November. Export prices fell 2.6%,
following a 0.3% drop the previous month. The increase in import prices was the first since June 2022.
Import prices increased 3.5% since December 2021. Fuel import prices rose 0.6% in December, while
nonfuel prices increased 0.4%. Export prices haven’t increased since June 2022. Prices for exports rose
5.0% for the 12 months ended in December, the smallest 12-month advance since January 2021.
The Treasury budget deficit for December was $85.0 billion, well above the $21.0 billion deficit of a year
ago but well under the November deficit of $248.5 billion. For the first three months of the 2023 fiscal
year, the deficit sat at $421.4 billion, up from $377.7 billion over the same period in fiscal year 2022.
Compared to the same period last fiscal year, government expenditures increased $17.4 billion, while
government receipts are down $26.3 billion.
According to the U.S. Energy Administration, the national average retail price for regular gasoline was
$3.259 per gallon on January 9, $0.036 per gallon above the prior week’s price but $0.036 lower than a
year ago. Also, as of January 9, the East Coast price increased $0.006 to $3.216 per gallon; the Gulf
Coast price dipped $0.001 to $2.890 per gallon; the Midwest price climbed $0.095 to $3.145 per gallon;
the West Coast price increased $0.022 to $3.961 per gallon; and the Rocky Mountain price advanced
$0.079 to $3.122 per gallon. Residential heating oil prices averaged $4.545 per gallon on January 9,
$0.118 below the previous week’s price but $1.085 per gallon more than a year ago. Looking ahead,
U.S. crude oil production is forecast to reach record highs in 2023 (12.4 million barrels per day) and
2024 (12.8 million barrels per day), which would surpass the previous annual record high of 12.3 million
barrels per day.
For the week ended January 7, there were 205,000 new claims for unemployment insurance, a
decrease of 1,000 from the previous week’s level, which was revised up by 2,000. According to the
Department of Labor, the advance rate for insured unemployment claims for the week ended December
31 was 0.1%, a decrease of one percentage point from the previous week’s rate. The advance number
of those receiving unemployment insurance benefits during the week ended December 31 was
1,634,000, a decrease of 63,000 from the previous week’s level, which was revised up by 3,000. States
and territories with the highest insured unemployment rates for the week ended December 24 were
Alaska (2.3%), New Jersey (2.2%), Minnesota (2.2%), California (2.0%), Montana (2.0%), Rhode Island
(2.0%), Puerto Rico (1.9%), Massachusetts (1.9%), Washington (1.8%), Illinois (1.7%), and New York
(1.7%). The largest increases in initial claims for unemployment insurance for the week ended
December 31 were in New Jersey (+4,514), Michigan (+3,322), New York (+3,169), Massachusetts, (+2,670), and Pennsylvania (+2,401), while the largest decreases were in Kentucky (-3,808), Illinois
(-3,439), Texas (-3,252), Missouri (-2,882), and Minnesota (-880).
Eye on the Week Ahead
measures the change in prices from the perspective of the seller of goods and services, is an important
inflation indicator. Producer prices rose 0.3% in November and were up 7.4% for the year. The retail sales
report for December is also out this week. Retail sales fell 0.6% in November. The Federal Reserve’s report
on industrial production for December is on tap for release this week. Industrial production slid 0.2% in
November. The housing sector waned for much of 2022. The December figures for housing starts,
completions, and issued building permits are available this week as is the December report on existing
home sales.
Key Dates/Data Releases
- 1/18: Producer Price Index,retail sales, industrialproduction
- 1/19: Housing starts
- 1/19: Existing home sales
Scarlet Oak Financial Services can be reached at 800.871.1219 or contact us here. Click here to sign up for our weekly newsletter with the latest economic news.
Data sources: Economic: Based on data from U.S. Bureau of Labor Statistics (unemployment, inflation);
U.S. Department of Commerce (GDP, corporate profits, retail sales, housing); S&P/Case-Shiller 20-City
Composite Index (home prices); Institute for Supply Management (manufacturing/services). Performance:
Based on data reported in WSJ Market Data Center (indexes); U.S. Treasury (Treasury yields); U.S.
Energy Information Administration/Bloomberg.com Market Data (oil spot price, WTI, Cushing, OK);
www.goldprice.org (spot gold/silver); Oanda/FX Street (currency exchange rates). News items are based
on reports from multiple commonly available international news sources (i.e., wire services) and are
independently verified when necessary with secondary sources such as government agencies, corporate
press releases, or trade organizations. All information is based on sources deemed reliable, but no
warranty or guarantee is made as to its accuracy or completeness. Neither the information nor any opinion
expressed herein constitutes a solicitation for the purchase or sale of any securities, and should not be
relied on as financial advice. Forecasts are based on current conditions, subject to change, and may not
come to pass. U.S. Treasury securities are guaranteed by the federal government as to the timely payment
of principal and interest. The principal value of Treasury securities and other bonds fluctuates with market
conditions. Bonds are subject to inflation, interest-rate, and credit risks. As interest rates rise, bond prices
typically fall. A bond sold or redeemed prior to maturity may be subject to loss. Past performance is no
guarantee of future results. All investing involves risk, including the potential loss of principal, and there can
be no guarantee that any investing strategy will be successful.
The Dow Jones Industrial Average (DJIA) is a price-weighted index composed of 30 widely traded
blue-chip U.S. common stocks. The S&P 500 is a market-cap weighted index composed of the common
stocks of 500 largest, publicly traded companies in leading industries of the U.S. economy. The NASDAQ
Composite Index is a market-value weighted index of all common stocks listed on the NASDAQ stock
exchange. The Russell 2000 is a market-cap weighted index composed of 2,000 U.S. small-cap common
stocks. The Global Dow is an equally weighted index of 150 widely traded blue-chip common stocks
worldwide. The U.S. Dollar Index is a geometrically weighted index of the value of the U.S. dollar relative to
six foreign currencies. Market indexes listed are unmanaged and are not available for direct investment.
IMPORTANT DISCLOSURES
Broadridge Investor Communication Solutions, Inc. does not provide investment, tax, legal, or retirement advice or recommendations. The
information presented here is not specific to any individual’s personal circumstances. To the extent that this material concerns tax matters, it is
not intended or written to be used, and cannot be used, by a taxpayer for the purpose of avoiding penalties that may be imposed by law. Each
taxpayer should seek independent advice from a tax professional based on his or her individual circumstances. These materials are provided for
general information and educational purposes based upon publicly available information from sources believed to be reliable — we cannot assure
the accuracy or completeness of these materials. The information in these materials may change at any time and without notice.
