
Market Week: July 17, 2023
Market Recap:
Wall Street enjoyed a positive week of returns, with each benchmark index posting solid gains. The financial sector started the release of second quarter updates last week, with some major banks reporting increased profits. Investors saw hope that inflation may be subsiding and the Federal Reserve may be nearing an end to its policy of interest rate hikes. Crude oil prices climbed higher last week. The Consumer Price Index rose 0.2% in June, while producer prices inched up 0.1%. Import and export prices continued to decline in June. The Treasury budget deficit was $227.8 billion in June. The national average retail price for regular gasoline was $3.546 per gallon on July 10. For the week ended July 8, there were 237,000 new claims for unemployment insurance.
The Markets (as of market close July 14, 2023)
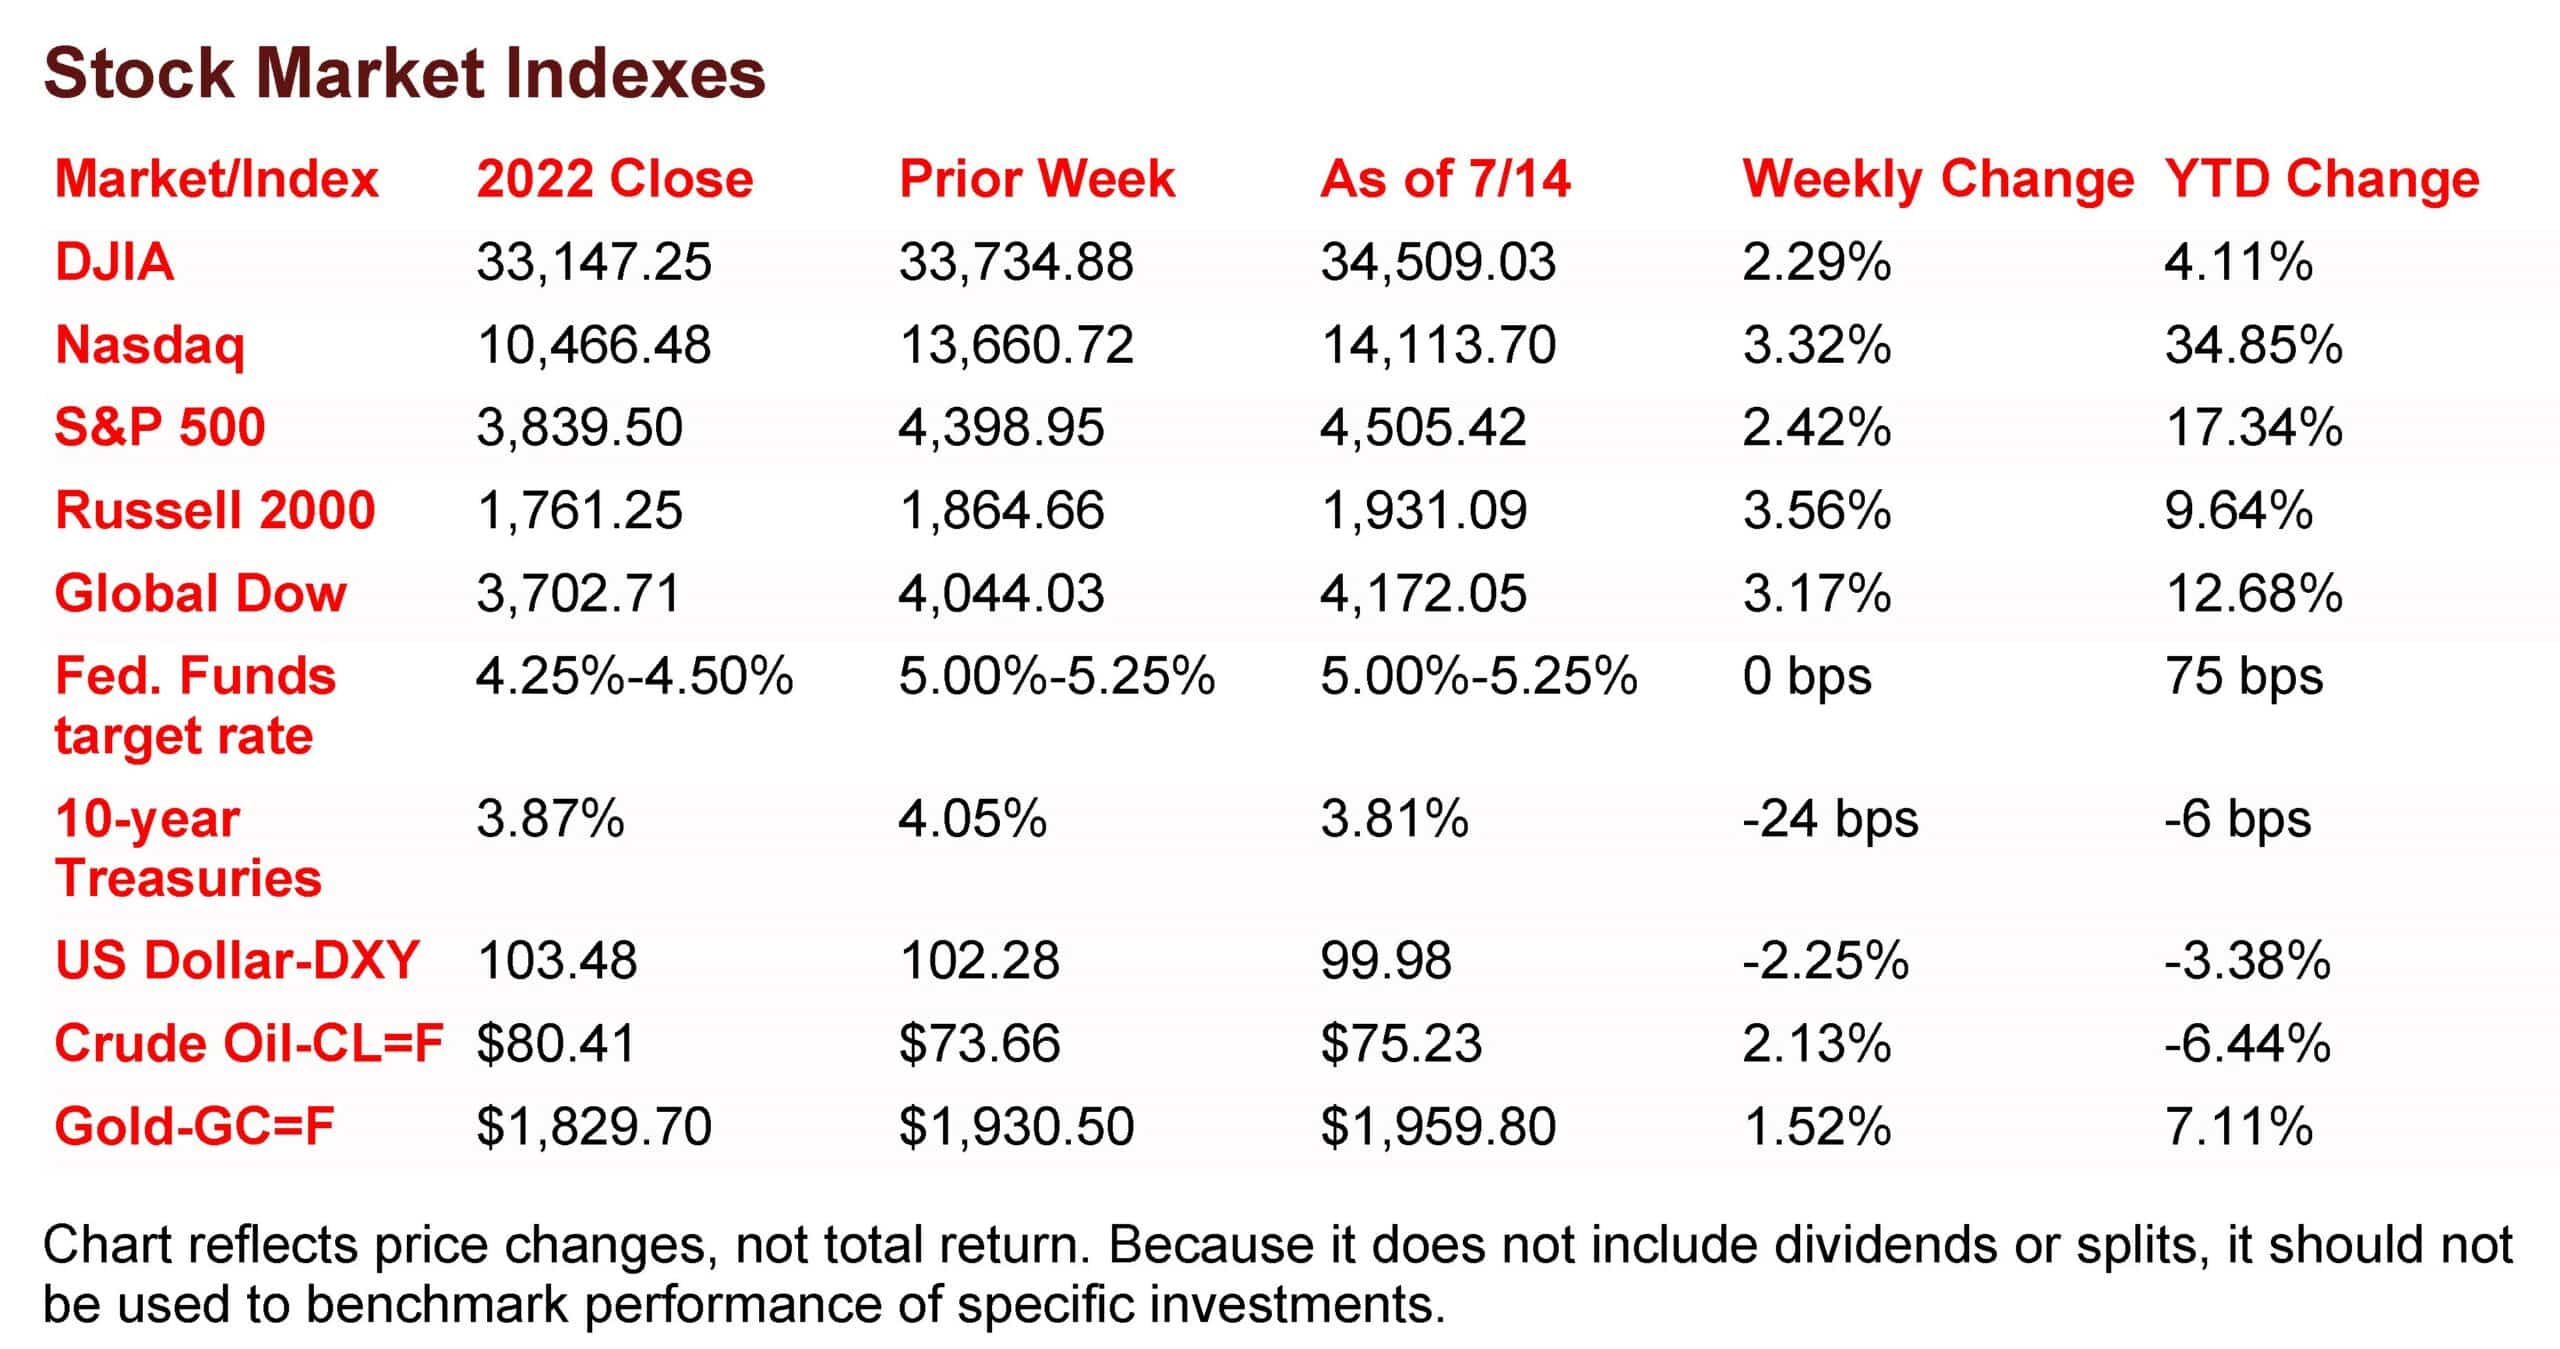
Wall Street enjoyed a positive week of returns, with each of the benchmark indexes posting solid gains, despite a marginal downturn at the end of last week. The financial sector began releasing quarterly updates last Friday as investors focused on the state of the banking industry. A few major banks reported increasing profits in the second quarter, while more data will be released this week. The Russell 2000, the Global Dow, and the Nasdaq gained over 3.0% last week, while the S&P 500 and the Dow advanced over 2.3%. Ten-year Treasury yields fell 24.0 basis points as investors saw hope that inflation may be subsiding and the Federal Reserve may be nearing an end to its policy of interest rate hikes. Crude oil prices climbed higher last week, despite last Friday’s drop, which was the largest decline since the end of last month. The dollar slid lower and is now down 3.4% year to date. Gold prices, on the other hand, rose higher last week and are up more than 7.0% for the year.
Last Monday saw investors grab some apparent bargains, pushing stocks higher to begin the week. The Russell 2000 led the benchmark indexes listed here, climbing 1.6%. The Dow advanced 0.6%, while the Global Dow (0.4%), the S&P 500 (0.2%), and the Nasdaq (0.2%) ticked higher. Ten-year Treasury yields settled at 4.06% after falling 4.4 basis points on rising bond prices. Crude oil prices ended a streak of increases, dipping 0.9% to $73.21 per barrel. The dollar and gold prices began last week on a downturn.
Stocks closed higher for the second straight session last Tuesday as investors awaited the Wednesday release of the Consumer Price Index report. The Global Dow rose 1.1% to head the indexes listed here. The Russell 2000 enjoyed a second day of notable gains after advancing 1.0%. The Dow rose 0.9%, followed by the S&P 500 (0.7%), and the Nasdaq (0.6%). Crude oil prices reversed the prior day’s downturn, climbing 2.6% to settle at $74.86 per barrel. The yield on 10-year Treasuries slipped 2.6 basis points to close at 3.98%. The dollar declined, while gold prices advanced.
Signs that inflation may be receding drove stocks and bond prices higher last Wednesday. A better-than-expected Consumer Price Index (see below) offered encouragement to investors that the Federal Reserve’s interest rate hikes may be nearing an end. For the second day in a row, the Global Dow (1.4%) led the benchmark indexes listed here, followed by the Nasdaq (1.2%), the Russell 2000 (1.1%), the S&P 500 (0.7%), and the Dow (0.3%). With bond prices climbing higher, yields on 10-year Treasuries fell nearly 12.0 basis points to close at 3.86%. Crude oil prices rose 1.4% to $75.86 per barrel. The dollar continued to decline, while gold prices continued to advance.
Stocks rallied for a fourth straight day last Thursday, with the S&P 500 and the Nasdaq reaching new intraday 52-week highs. Tech stocks were some of the highest climbers helping to drive the indexes. The Nasdaq rose 1.6%, followed by the Global Dow (1.1%), the Russell 2000 and the S&P 500 (0.9%), and the Dow (0.1%). Bond prices continued to climb, pulling yields lower. Ten-year Treasury yields fell 10.0 basis points to settle at 3.76%. Crude oil prices advanced for the third straight day, reaching $77.31 per barrel. The dollar continued to slide, falling 0.8%. Gold prices inched up 0.2%.
Last Friday saw stocks close generally lower, with only the Dow posting a 0.3% gain among the benchmark indexes listed here. The Russell 2000 fell 1.0%, the Global Dow dipped 0.5%, the Nasdaq slipped 0.2%, and the S&P 500 declined 0.1%. Ten-year Treasury yields rose 5.8 basis points. The dollar advanced for the only day last week, while gold prices fell. Crude oil prices dropped 2.2% to $75.23 per barrel.
 Last Week’s Economic News
The Consumer Price Index rose 0.2% in June after advancing 0.1% in May. Shelter prices (0.4%) accounted for over 70% of the CPI increase in June. Also advancing in June were prices for motor vehicles, insurance, apparel, recreation, and personal care. Prices for airline fares, communication, used cars and trucks, and household furnishings and operations were among those that decreased last month. Prices less food and energy rose 0.2% in June, the smallest one-month increase since August 2021. Over the last 12 months, the CPI rose 3.0%, which is the smallest yearly increase since the period ended March 2021. The CPI less food and energy rose 4.8% over the last 12 months. Energy prices decreased 16.7% for the 12 months ended in June, while the food prices increased 5.7%.
Producer prices inched up 0.1% in June after declining 0.4% in the previous month. Since June 2022, Producer prices have risen 0.1%. Pushing producer prices higher was a 0.2% increase in prices for services. Prices for goods were unchanged in June. producer prices less foods, energy, and trade services moved up 0.1% in June after no change in May. For the 12 months ended in June, producer prices less foods, energy, and trade services advanced 2.6%.
Import and export prices continued to decline in June. According to the latest report from the Bureau of Labor Statistics, import prices fell 0.2% in June after decreasing 0.4% in May. Export prices declined 0.9% in June following a 1.9% drop the previous month. In 2003, import prices have fallen in five of the last six months after rising 3.2% in 2022. Import prices declined 6.1% thus far this year, the largest 12-month drop since the year ended May 2020. Export prices fell 12.0% from June 2022 to June 2023, the largest 12-month decline since the data was first published in September 1984.
The Treasury budget deficit was $227.8 billion in June, a decrease of about $12.6 billion from the May deficit but $139.0 billion above the June 2022 deficit. Through the first nine months of the fiscal year, the government deficit sits at $1.392 trillion compared to $515.1 billion over the same period in the prior fiscal year. Compared to last fiscal year, government receipts are down $422.8 billion, while government expenditures rose by $454.7 billion.
The national average retail price for regular gasoline was $3.546 per gallon on July 10, $0.019 per gallon hither than the prior week’s price but $1.100 less than a year ago. Also, as of July 10, the East Coast price increased $0.057 to $3.429 per gallon; the Midwest price fell $0.027 to $3.362 per gallon; the Gulf Coast price rose $0.044 to $3.152 per gallon; the Rocky Mountain price declined $0.042 to $3.748 per gallon; and the West Coast price inched up $0.001 to $4.534 per gallon. The U.S. Energy Information Administration forecasts higher oil prices in the second half of 2023 and into 2024. EIA expects production cuts from OPEC members and higher demand, which will likely drive Brent crude oil prices to the mid $80.00 per barrel range by the end of 2024.
For the week ended July 8, there were 237,000 new claims for unemployment insurance, a decrease of 12,000 from the previous week’s level, which was revised up by 1,000. According to the Department of Labor, the advance rate for insured unemployment claims for the week ended July 1 was 1.2%, unchanged from the previous week’s rate. The advance number of those receiving unemployment insurance benefits during the week ended July 1 was 1,729,000, an increase of 11,000 from the previous week’s level, which was revised down by 2,000. States and territories with the highest insured unemployment rates for the week ended June 24 were California (2.2%), New Jersey (2.2%), Puerto Rico (2.2%), Massachusetts (1.9%), Connecticut (1.8%), Rhode Island (1.8%), New York (1.7%), Oregon (1.7%), Pennsylvania (1.7%), and Minnesota (1.6%). The largest increases in initial claims for unemployment insurance for the week ended July 1 were in Michigan (+6,792), New York (+4,152), Ohio (+3,028), Kentucky (+2,449), and Indiana (+1,549), while the largest decreases were in Texas (-3,126), New Jersey (-1,137), Colorado (-509), Wisconsin (-504), and Connecticut (-446).
Eye on the Week Ahead
The June retail sales report is released this week. May saw retail sales increase by 0.3% from the previous month. The June report on industrial production is also out this week. Industrial production has been somewhat flat over the past few months, decreasing 0.2% in May. June reports on housing starts and existing home sales are available this week. In general, new home sales have increased throughout the year, while sales of existing homes have declined, primarily due to rising mortgage rates and a dearth of inventory.
Key Dates/Data Releases
- 7/18: Retail sales, industrial production
- 7/19: Housing starts
- 7/20: Existing home sales
Scarlet Oak Financial Services can be reached at 800.871.1219 or contact us here. Click here to sign up for our weekly newsletter with the latest economic news.
Data sources:
Economic: Based on data from U.S. Bureau of Labor Statistics (unemployment, inflation);
U.S. Department of Commerce (GDP, corporate profits, retail sales, housing); S&P/Case-Shiller 20-City Composite Index (home prices); Institute for Supply Management (manufacturing/services). Performance: Based on data reported in WSJ Market Data Center (indexes); U.S. Treasury (Treasury yields); U.S. Energy Information Administration/Bloomberg.com Market Data (oil spot price, WTI, Cushing, OK); www.goldprice.org (spot gold/silver); Oanda/FX Street (currency exchange rates).
News items are based on reports from multiple commonly available international news sources (i.e., wire services) and are independently verified when necessary with secondary sources such as government agencies, corporate press releases, or trade organizations. All information is based on sources deemed reliable, but no warranty or guarantee is made as to its accuracy or completeness. Neither the information nor any opinion expressed herein constitutes a solicitation for the purchase or sale of any securities, and should not be relied on as financial advice. Forecasts are based on current conditions, subject to change, and may not come to pass. U.S. Treasury securities are guaranteed by the federal government as to the timely payment of principal and interest. The principal value of Treasury securities and other bonds fluctuates with market conditions. Bonds are subject to inflation, interest-rate, and credit risks. As interest rates rise, bond prices typically fall. A bond sold or redeemed prior to maturity may be subject to loss. Past performance is no guarantee of future results. All investing involves risk, including the potential loss of principal, and there can be no guarantee that any investing strategy will be successful.
The Dow Jones Industrial Average (DJIA) is a price-weighted index composed of 30 widely traded blue-chip U.S. common stocks. The S&P 500 is a market-cap weighted index composed of the common stocks of 500 largest, publicly traded companies in leading industries of the U.S. economy. The NASDAQ Composite Index is a market-value weighted index of all common stocks listed on the NASDAQ stock exchange. The Russell 2000 is a market-cap weighted index composed of 2,000 U.S. small-cap common stocks. The Global Dow is an equally weighted index of 150 widely traded blue-chip common stocks worldwide. The U.S. Dollar Index is a geometrically weighted index of the value of the U.S. dollar relative to six foreign currencies. Market indexes listed are unmanaged and are not available for direct investment.
Broadridge Investor Communication Solutions, Inc. prepared this material for use by Scarlet Oak Financial Services.
Broadridge Investor Communication Solutions, Inc. does not provide investment, tax, legal, or retirement advice or recommendations. The information presented here is not specific to any individual’s personal circumstances. To the extent that this material concerns tax matters, it is not intended or written to be used, and cannot be used, by a taxpayer for the purpose of avoiding penalties that may be imposed by law. Each taxpayer should seek independent advice from a tax professional based on individual circumstances. Scarlet Oak Financial Services provide these materials for general information and educational purposes based upon publicly available information from sources believed to be reliable — we cannot assure the accuracy or completeness of these materials. The information in these materials may change at any time and without notice.
