
Market Week: September 5, 2023
Market Recap:
The past week in the financial markets marked a strong upturn, representing the most favorable performance since June. Various benchmark indexes reported substantial gains, driven in part by the latest jobs report indicating a slowdown in the labor market and a rise in unemployment. These signals has led investors to speculate that the Federal Reserve might opt to pause its planned interest rate hikes scheduled for later this month. The surge in market sectors was led by information technology, which saw a 5.3% increase, closely followed by energy with a 4.9% rise. Crude oil prices also rebounded, putting an end to a two-week losing streak, thanks to a more than 7.0% increase during the week and an impressive 30.0% rise over the past two months. This uptick followed the extension of production cuts by the Saudi-led OPEC+ alliance. Additionally, the week saw gains in the value of the dollar and gold prices.
Stock markets began the week on an upward trajectory as investors eagerly awaited inflation data and the release of August’s job figures later in the week. The Global Dow led the way with a 1.0% gain, followed by the Russell 2000 (0.9%), and the Nasdaq (0.8%), while the S&P 500 and the Dow both advanced by 0.6%. Meanwhile, ten-year Treasury yields moved lower to close at 4.21%, while crude oil prices experienced a modest 0.4% increase, settling at around $80.13 per barrel. The dollar saw a slight dip, declining by less than 0.1%, while gold prices gained 0.4%. Overall, it was a week marked by a mix of optimism, economic data, and fluctuations in various asset classes, with investors keeping a close eye on central bank actions and economic indicators.
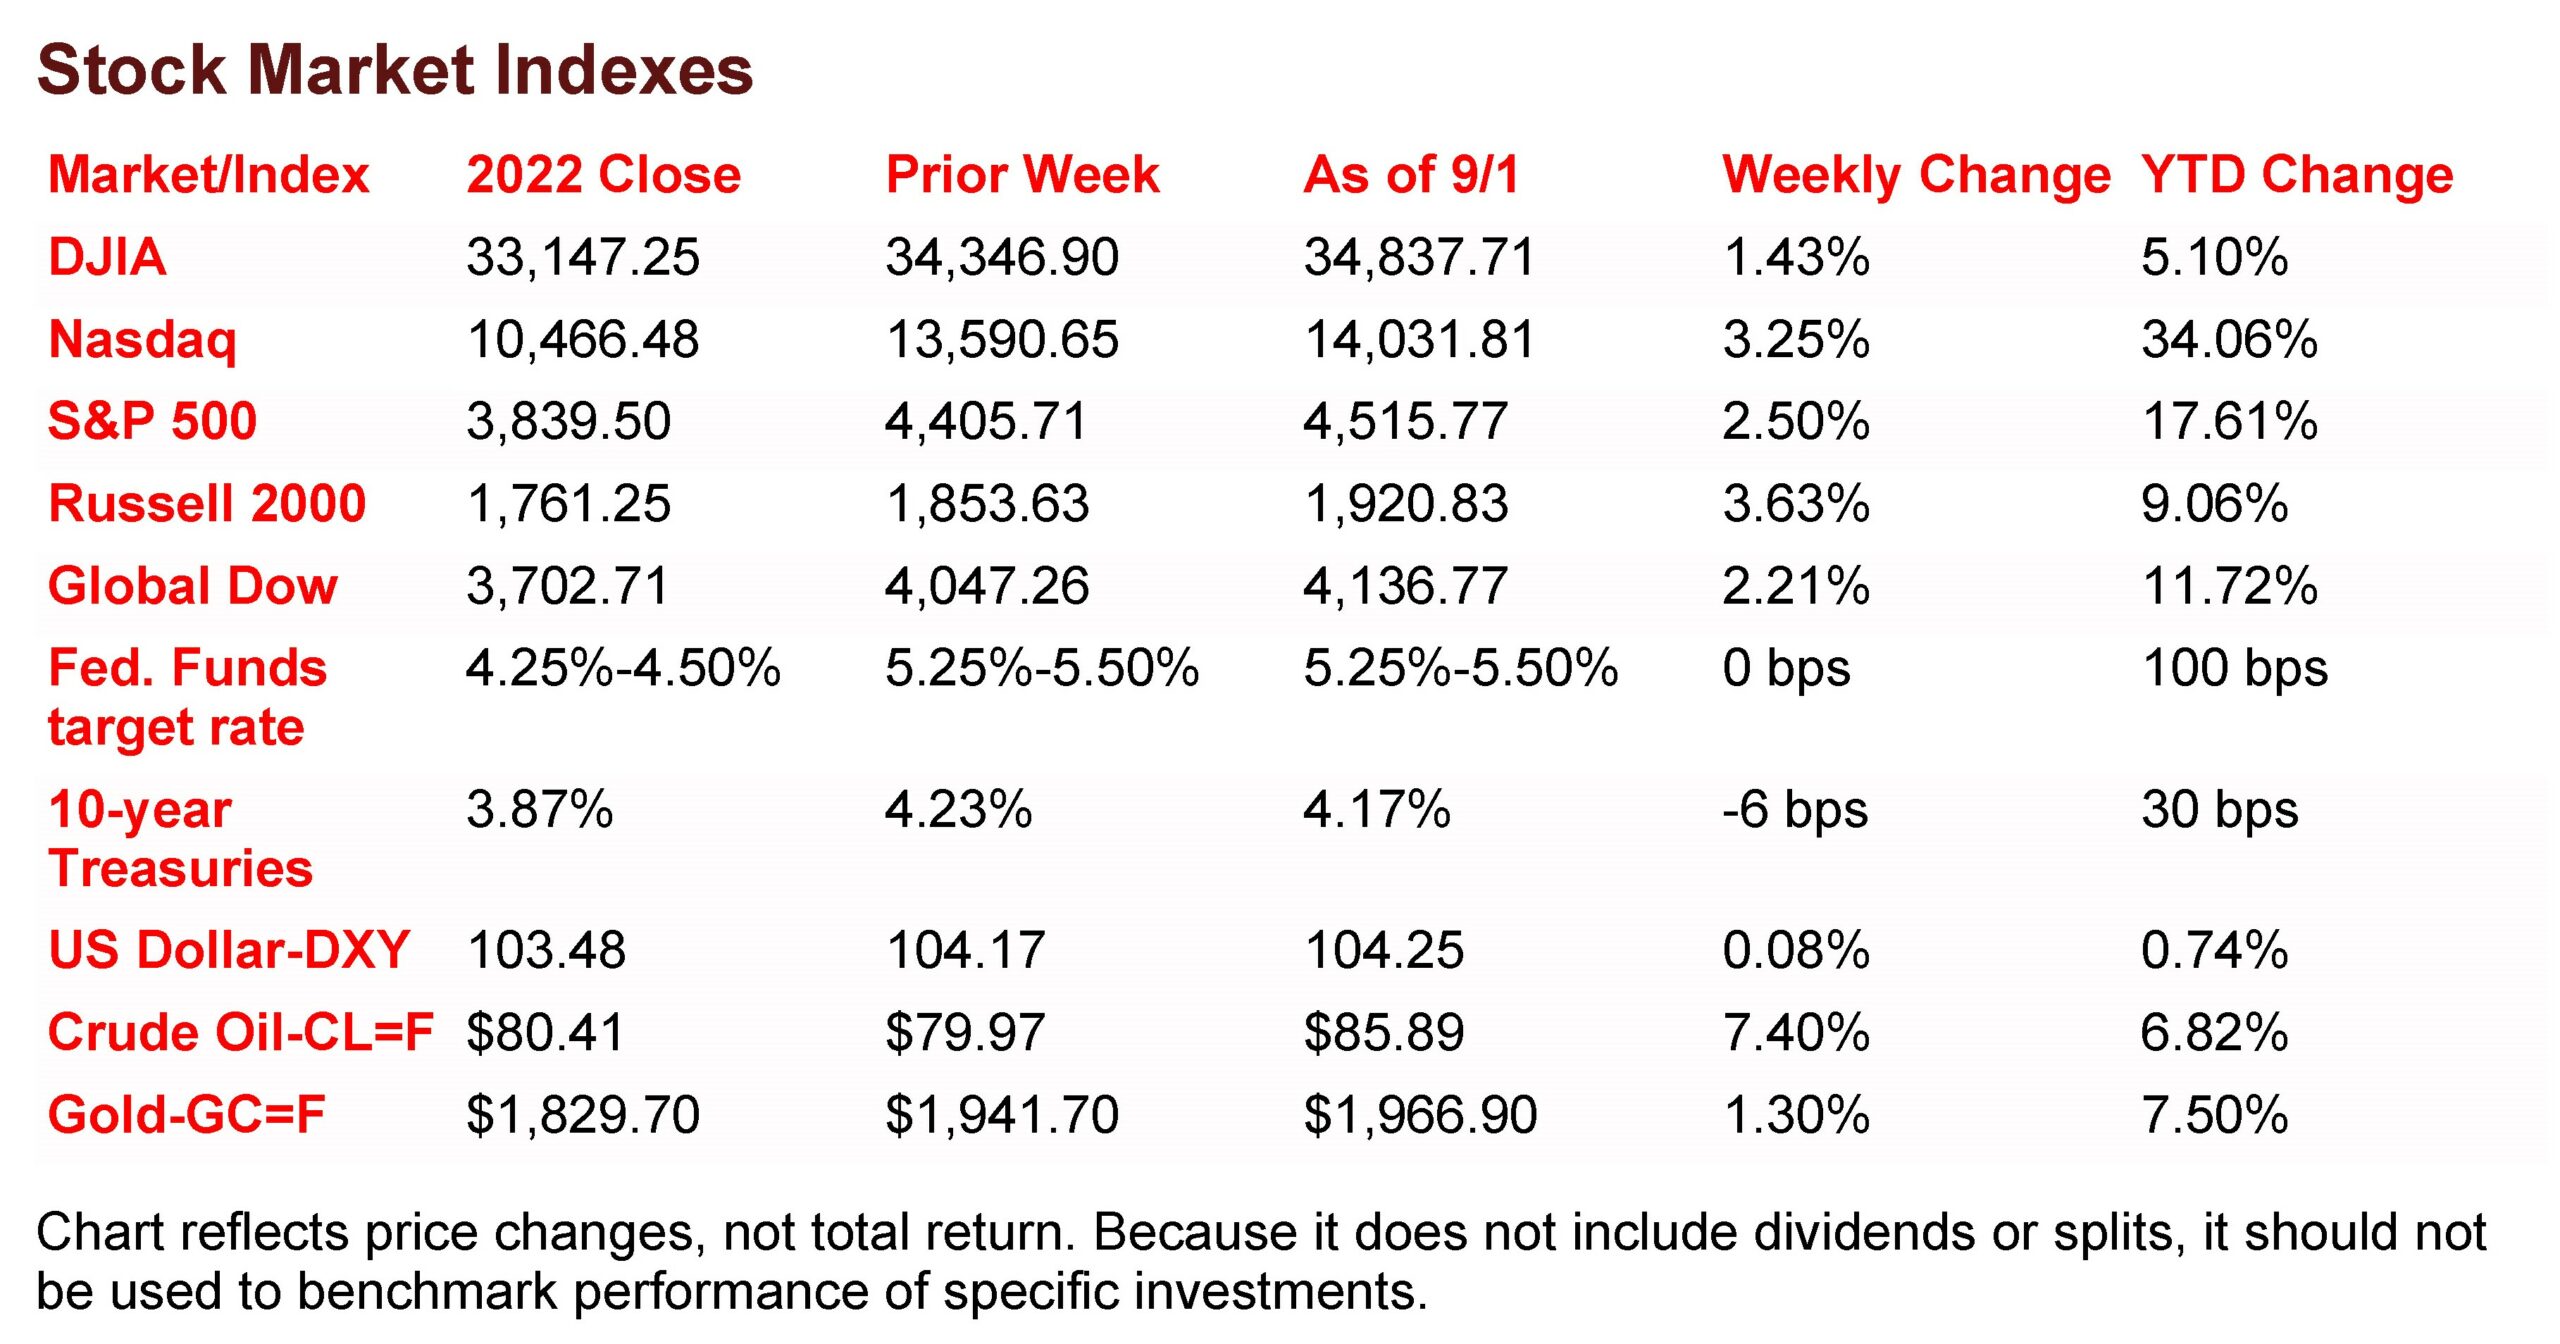
The Markets (as of market close September 1, 2023)
The markets enjoyed their best week since June, with each of the benchmark indexes listed here posting solid gains. The latest jobs report (see below) showed the labor market has slowed over the past few months, while unemployment has risen, giving investors reason to think the Federal Reserve may pause interest rate hikes later this month. The majority of the market sectors moved higher, with information technology (5.3%) and energy (4.9%), leading the way. Crude oil prices ended a two-week losing streak after rising more than 7.0% last week and over 30.0% over the past two months as the Saudi-led OPEC+ extended production cuts. The dollar and gold prices closed higher.
Stocks opened last week higher as investors looked ahead to inflation data and the August jobs figures scheduled for release later in the week. The Global Dow led the benchmark indexes listed here, gaining 1.0%, followed by the Russell 2000 (0.9%) and the Nasdaq (0.8%), while the S&P 500 and the Dow advanced 0.6%. Ten-year Treasury yields slipped lower, closing at 4.21%. Crude oil prices edged higher, up 0.4% to settle at about $80.13 per barrel. The dollar dipped less than 0.1%, while gold prices rose 0.4%.
Markets notched their third straight day of gains last Tuesday. The Nasdaq climbed 1.7% to lead the benchmark indexes listed here. Following close behind the tech-heavy index were the S&P 500 (1.5%) and the Russell 2000 (1.4%). The Global Dow (1.3%) and the Dow (0.9%) also posted notable gains. A decline in job openings in July (see below) may have boosted investor hopes that the Federal Reserve would pause interest rate hikes, at least when it meets in September. Long-term bond yields declined, with 10-year Treasury yields slipping to 4.12%. Falling bond yields helped support growth stocks, with mega cap growth shares closing higher. Crude oil prices advanced again, jumping 1.4% to settle at $81.25 per barrel. The dollar fell more than 0.5%, while gold prices increased nearly 1.0%.
Each of the benchmark indexes listed here closed last Wednesday higher, notching their fourth consecutive day of gains. Once again, the tech-heavy Nasdaq led the way, climbing 0.5%, followed by the S&P 500, the Russell 2000, and the Global Dow, each of which gained 0.4%. The Dow eked out a 0.1% advance. Ten-year Treasury yields dipped lower, losing 0.4 basis points to sit at 4.11%. Crude oil prices rose to $81.65 per barrel, up 0.6% on the day. The dollar declined 0.4%, while gold prices gained 0.3%.
Stocks closed generally lower last Thursday, with only the Nasdaq able to eke out a 0.1% gain. The Dow fell 0.5%, followed by the Global Dow (-0.3%), while the S&P 500 and the Russell 2000 dipped 0.2%. Crude oil prices continued to surge, climbing 2.4% to settle at $83.58 per barrel, as OPEC+ announced further cuts in production. Ten-year Treasury yields fell 2.5 basis points to 4.09%. The dollar jumped 0.5%, while gold prices declined 0.3%.
Wall Street ended last week on a high note, with stocks climbing higher last Friday, with the exception of the Nasdaq, which ended the session flat. The Russell 2000 rose 1.1%, the Dow gained 0.3%, while the the S&P 500 and the Global Dow inched up 0.2%. Bond prices slid lower, driving yields higher. Ten-year Treasury yields climbed 8.0 basis points, settling at 4.17%. The dollar and gold prices posted gains to end the week. Crude oil prices vaulted 2.7% to $85.89 per barrel.
 Last Week’s Economic News
According to the latest Personal Income and Outlays report from the Bureau of Economic Analysis, July saw personal income increase 0.2%, although disposable (after-tax) income was unchanged from the previous month. The personal consumption expenditures price index, the preferred inflation indicator of the Federal Reserve, advanced 0.2% in July. Excluding food and energy (core prices), the PCE price index also increased 0.2%. However, over the past 12 months ended in July, consumer prices increased 3.3%, an increase of 0.3 percentage point over the comparable period ended in June. Core prices rose 4.2% since July 2022, up 0.1 percentage point from the 12-month period ended in June, but well below the percentage changes for the 12-month periods ended in March, April, and May. In July, consumer spending rose 0.8%, following an increase of 0.6% in June.
There were 187,000 new jobs added in August, less than the average monthly gain of 271,000 over the prior 12 months. The August total, coupled with a net downward revision of 110,000 over the previous two months, suggests that hiring has slowed considerably since the spring. In August, job gains occurred in health care, leisure and hospitality, social assistance, and construction. The unemployment rate rose by 0.3 percentage point to 3.8% in August, and the number of unemployed persons increased by 514,000 to 6.4 million. Both measures are similar to a year earlier, when the unemployment rate was 3.7% and the number of unemployed persons was 6.0 million. Among the unemployed, the number of workers who lost jobs and persons who completed temporary jobs increased by 294,000 to 2.9 million in August, offsetting a decrease of 280,000 in July. In August, the labor force participation rate rose by 0.2 percentage point to 62.8% after being flat since March. The employment-population ratio was unchanged over the month at 60.4%. In August, average hourly earnings rose by $0.08, or 0.2%, to $33.82. Over the past 12 months, average hourly earnings have increased by 4.3%. The average workweek edged up by 0.1 hour to 34.4 hours in August.
The second estimate of gross domestic product for the second quarter revealed that the economy expanded at an annualized rate of 2.1%, comparable to the 2.0% increase in the first quarter. Consumer prices, as measured by the personal consumption expenditures price index, rose 2.5% and 3.7%, excluding food and energy. Consumer spending increased 1.7%, down from 4.2% in the first quarter. Fixed investment advanced 3.9%, driven higher by a 6.1% increase in nonresidential fixed investment. Residential investment dipped 3.6%. Both exports (-10.6%) and imports (-7.0%) declined in the second quarter. Federal government spending increased 1.2%, while state and local government spending advanced 4.7%.
In July, the number of job openings edged down 338,000 to 8.8 million. Over the month, job openings decreased in professional and business services (-198,000); health care and social assistance (-130,000); state and local government, excluding education (-67,000); state and local government education (-62,000); and federal government (-27,000). By contrast, job openings increased in information (+101,000) and in transportation, warehousing, and utilities (+75,000). The number of hires also declined in July, falling 167,000 to 5.8 million. Total separations decreased 208,000 to 5.5 million. Within separations, the number of quits decreased to 3.5 million (-253,000), while the number of layoffs and discharges changed little.
The advance report on international trade in goods showed the trade deficit expanded by $2.3 billion, or 2.6%, in July. Exports of goods rose 1.5%, while imports advanced 1.9%.
Manufacturing contracted further in August. The S&P Global US Manufacturing PMI fell to 47.9 in August, down from 49.0 in July. A reading of less than 50.0 indicates contraction in the manufacturing sector. Manufacturing has trended lower every month since November 2022, expect for a brief uptick in April. The reduction in business conditions were driven by a decline in new orders, which survey respondents blamed on a weakening economy. Demand for goods produced in the U.S. has fallen 13 times in the past 15 months. In addition, export orders decreased for the 15th straight month in August.
The national average retail price for regular gasoline was $3.813 per gallon on August 28, $0.055 per gallon lower than the prior week’s price and $0.014 less than a year ago. Also, as of August 28, the East Coast price decreased $0.050 to $3.678 per gallon; the Midwest price fell $0.083 to $3.637 per gallon; the Gulf Coast price dropped $0.080 to $3.378 per gallon; the Rocky Mountain price fell $0.064 to $3.075 per gallon; and the West Coast price advanced $0.014 to $4.880 per gallon. According to the
U.S. Energy Information Administration, Hurricane Idalia impacted U.S. Gulf Coast production and pipeline facilities. In addition, over the past several weeks, a combination of crude oil production cuts by Saudi Arabia, low U.S. gasoline inventories, and announced refinery maintenance in the Northeast have increased the regular gasoline retail price by 6.0% ($0.22/gal).
For the week ended August 26, there were 228,000 new claims for unemployment insurance, a decrease of 4,000 from the previous week’s level, which was revised up by 2,000. According to the Department of Labor, the advance rate for insured unemployment claims for the week ended August 19 was 1.2%, an increase of 0.1% from the previous week’s rate. The advance number of those receiving unemployment insurance benefits during the week ended August 19 was 1,725,000, an increase of 28,000 from the previous week’s level, which was revised down by 5,000. States and territories with the highest insured unemployment rates for the week ended August 12 were New Jersey (2.5%), California (2.2%), Puerto Rico (2.2%), Massachusetts (2.0%), Rhode Island (2.0%), New York (1.9%), Connecticut (1.8%), Oregon (1.8%), Pennsylvania (1.8%), and Minnesota (1.7%). The largest increases in initial claims for unemployment insurance for the week ended August 19 were in Hawaii (+3,553), South Carolina (+113), Vermont (+105), New Mexico (+62), and Idaho (+51), while the largest decreases were in Ohio (-5,905), Illinois (-1,266), New Jersey (-1,182), Virginia (-1,149), and California (-1,083).
Eye on the Week Ahead
The first full week of September is a slow one for the release of important economic information. The July report on international trade in goods and services is available this week. The trade deficit fell by over 4.0% in June, with imports declining by 1.0%. Also out this week are the August survey results from purchasing managers in the services sector. Unlike manufacturing, services has seen growth for much of the year.
Key Dates/Data Releases
- 9/6: International trade in goods and services, S&P Services PMI
Scarlet Oak Financial Services can be reached at 800.871.1219 or contact us here. Click here to sign up for our weekly newsletter with the latest economic news.
Data sources:
Economic: Based on data from U.S. Bureau of Labor Statistics (unemployment, inflation);
U.S. Department of Commerce (GDP, corporate profits, retail sales, housing); S&P/Case-Shiller 20-City Composite Index (home prices); Institute for Supply Management (manufacturing/services). Performance: Based on data reported in WSJ Market Data Center (indexes); U.S. Treasury (Treasury yields); U.S. Energy Information Administration/Bloomberg.com Market Data (oil spot price, WTI, Cushing, OK); www.goldprice.org (spot gold/silver); Oanda/FX Street (currency exchange rates).
News items are based on reports from multiple commonly available international news sources (i.e., wire services) and are independently verified when necessary with secondary sources such as government agencies, corporate press releases, or trade organizations. All information is based on sources deemed reliable, but no warranty or guarantee is made as to its accuracy or completeness. Neither the information nor any opinion expressed herein constitutes a solicitation for the purchase or sale of any securities, and should not be relied on as financial advice. Forecasts are based on current conditions, subject to change, and may not come to pass. U.S. Treasury securities are guaranteed by the federal government as to the timely payment of principal and interest. The principal value of Treasury securities and other bonds fluctuates with market conditions. Bonds are subject to inflation, interest-rate, and credit risks. As interest rates rise, bond prices typically fall. A bond sold or redeemed prior to maturity may be subject to loss. Past performance is no guarantee of future results. All investing involves risk, including the potential loss of principal, and there can be no guarantee that any investing strategy will be successful.
The Dow Jones Industrial Average (DJIA) is a price-weighted index composed of 30 widely traded blue-chip U.S. common stocks. The S&P 500 is a market-cap weighted index composed of the common stocks of 500 largest, publicly traded companies in leading industries of the U.S. economy. The NASDAQ Composite Index is a market-value weighted index of all common stocks listed on the NASDAQ stock exchange. The Russell 2000 is a market-cap weighted index composed of 2,000 U.S. small-cap common stocks. The Global Dow is an equally weighted index of 150 widely traded blue-chip common stocks worldwide. The U.S. Dollar Index is a geometrically weighted index of the value of the U.S. dollar relative to six foreign currencies. Market indexes listed are unmanaged and are not available for direct investment.
Broadridge Investor Communication Solutions, Inc. prepared this material for use by Scarlet Oak Financial Services.
Broadridge Investor Communication Solutions, Inc. does not provide investment, tax, legal, or retirement advice or recommendations. The information presented here is not specific to any individual’s personal circumstances. To the extent that this material concerns tax matters, it is not intended or written to be used, and cannot be used, by a taxpayer for the purpose of avoiding penalties that may be imposed by law. Each taxpayer should seek independent advice from a tax professional based on individual circumstances. Scarlet Oak Financial Services provide these materials for general information and educational purposes based upon publicly available information from sources believed to be reliable — we cannot assure the accuracy or completeness of these materials. The information in these materials may change at any time and without notice.
