
In this week’s recap: Stocks soar, despite mixed messages on fiscal stimulus.
Weekly Economic Update
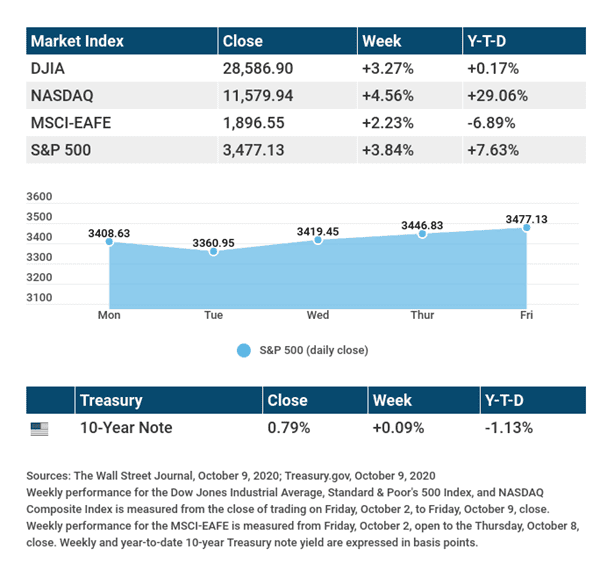
THE WEEK ON WALL STREET
Stocks staged a powerful rally last week, riding a wave of optimism over the prospect of the passage of a new fiscal stimulus bill.
The Dow Jones Industrial Average rose 3.27%, while the Standard & Poor’s 500 increased 3.84%. The Nasdaq Composite index gained 4.56% for the week. The MSCI EAFE index, which tracks developed overseas stock markets, advanced 2.23%.1-3
Stimulus Stalemate?
The anticipation of lawmakers passing a new round of economic stimulus was a decisive driver of market action all week.
A mid-week tweet by President Trump announcing that he was ending stimulus negotiations sent stocks lower. Losses were exacerbated by sharp declines in some mega-cap technology companies as details emerged from a House Judiciary subcommittee report on its investigation into their competitive practices.4
Stocks quickly reversed direction, climbing after the President tweeted that he would sign a limited stimulus bill, but lawmakers appeared to reject a piecemeal approach.
Stocks consolidated on Friday, helped by continuing stimulus talks and new election polls that suggested that the risk of a contested outcome appeared to be fading.
Small Cap Rally
The outperformance of large cap stocks relative to small cap stocks has been both wide and persistent during the last ten years. Last week’s action in small cap stocks, as represented by the Russell 2000 Index, indicates that smaller companies may finally be making up some ground.5
Last week, the Russell 2000 Index rose 6.33%, outperforming the S&P 500 by 2.4%.6
While this outperformance may be fleeting, a potential broadening of the stock market rally may be considered a healthy development.
Final Thoughts
This week begins the third-quarter earnings season, with companies from a variety of industry sectors reporting (see below). Early earnings reports start predominantly with the major banks, whose earnings results may provide insight into the general health of American consumers.
As is often the case, company guidance about the future earnings may be of greater interest to investors than past results.
THE WEEK AHEAD: KEY ECONOMIC DATA
- Tuesday: Consumer Price Index (CPI).
- Thursday: Jobless Claims.
- Friday: Industrial Production. Consumer Sentiment.
Source: Econoday, October 9, 2020
The Econoday economic calendar lists upcoming U.S. economic data releases (including key economic indicators), Federal Reserve policy meetings, and speaking engagements of Federal Reserve officials. The content is developed from sources believed to be providing accurate information. The forecasts or forward-looking statements are based on assumptions and may not materialize. The forecasts also are subject to revision.
THE WEEK AHEAD: COMPANIES REPORTING EARNINGS
- Tuesday: Johnson & Johnson (JNJ), J.P. Morgan Chase (JPM), Citigroup (C), Blackrock (BLK).
- Wednesday: Bank of America (BAC), UnitedHealth Group (UNH).
- Thursday: Morgan Stanley (MS).
- Friday: Schlumberger (SLB), J.B. Hunt Transport Services (JBHT), Kansas City Southern (KSU), V.F. Corporation (VFC).
Source: Zacks, October 9, 2020
Companies mentioned are for informational purposes only. It should not be considered a solicitation for the purchase or sale of the securities. Investing involves risks, and investment decisions should be based on your own goals, time horizon, and tolerance for risk. The return and principal value of investments will fluctuate as market conditions change. When sold, investments may be worth more or less than their original cost. Companies may reschedule when they report earnings without notice.
Scarlet Oak Financial Services can be reached at 800.871.1219 or contact us here.
Investing involves risks, and investment decisions should be based on your own goals, time horizon, and tolerance for risk. The return and principal value of investments will fluctuate as market conditions change. When sold, investments may be worth more or less than their original cost.
The forecasts or forward-looking statements are based on assumptions, may not materialize, and are subject to revision without notice.
The market indexes discussed are unmanaged, and generally, considered representative of their respective markets. Index performance is not indicative of the past performance of a particular investment. Indexes do not incur management fees, costs, and expenses. Individuals cannot directly invest in unmanaged indexes. Past performance does not guarantee future results.
The Dow Jones Industrial Average is an unmanaged index that is generally considered representative of large-capitalization companies on the U.S. stock market. Nasdaq Composite is an index of the common stocks and similar securities listed on the Nasdaq stock market and is considered a broad indicator of the performance of technology and growth companies. The MSCI EAFE Index was created by Morgan Stanley Capital International (MSCI) and serves as a benchmark of the performance of major international equity markets, as represented by 21 major MSCI indexes from Europe, Australia, and Southeast Asia. The S&P 500 Composite Index is an unmanaged group of securities that are considered to be representative of the stock market in general.
U.S. Treasury Notes are guaranteed by the federal government as to the timely payment of principal and interest. However, if you sell a Treasury Note prior to maturity, it may be worth more or less than the original price paid. Fixed income investments are subject to various risks including changes in interest rates, credit quality, inflation risk, market valuations, prepayments, corporate events, tax ramifications and other factors.
International investments carry additional risks, which include differences in financial reporting standards, currency exchange rates, political risks unique to a specific country, foreign taxes and regulations, and the potential for illiquid markets. These factors may result in greater share price volatility.
Please consult your financial professional for additional information.
This content is developed from sources believed to be providing accurate information. The information in this material is not intended as tax or legal advice. Please consult legal or tax professionals for specific information regarding your individual situation. This material was developed and produced by FMG Suite to provide information on a topic that may be of interest. FMG is not affiliated with the named representative, financial professional, Registered Investment Advisor, Broker-Dealer, nor state- or SEC-registered investment advisory firm. The opinions expressed and material provided are for general information, and they should not be considered a solicitation for the purchase or sale of any security.
Copyright 2020 FMG Suite.
CITATIONS:
- The Wall Street Journal, October 9, 20202. The Wall Street Journal, October 9, 2020
3. The Wall Street Journal, October 9, 2020
4. CNBC.com, October 6, 2020
5. The Wall Street Journal, October 8, 2020
6. The Wall Street Journal, October 9, 2020
CHART CITATIONS:
The Wall Street Journal, October 9, 2020
The Wall Street Journal, October 9, 2020
Treasury.gov, October 9, 2020
