
Market Week: June 26, 2023
Market Recap:
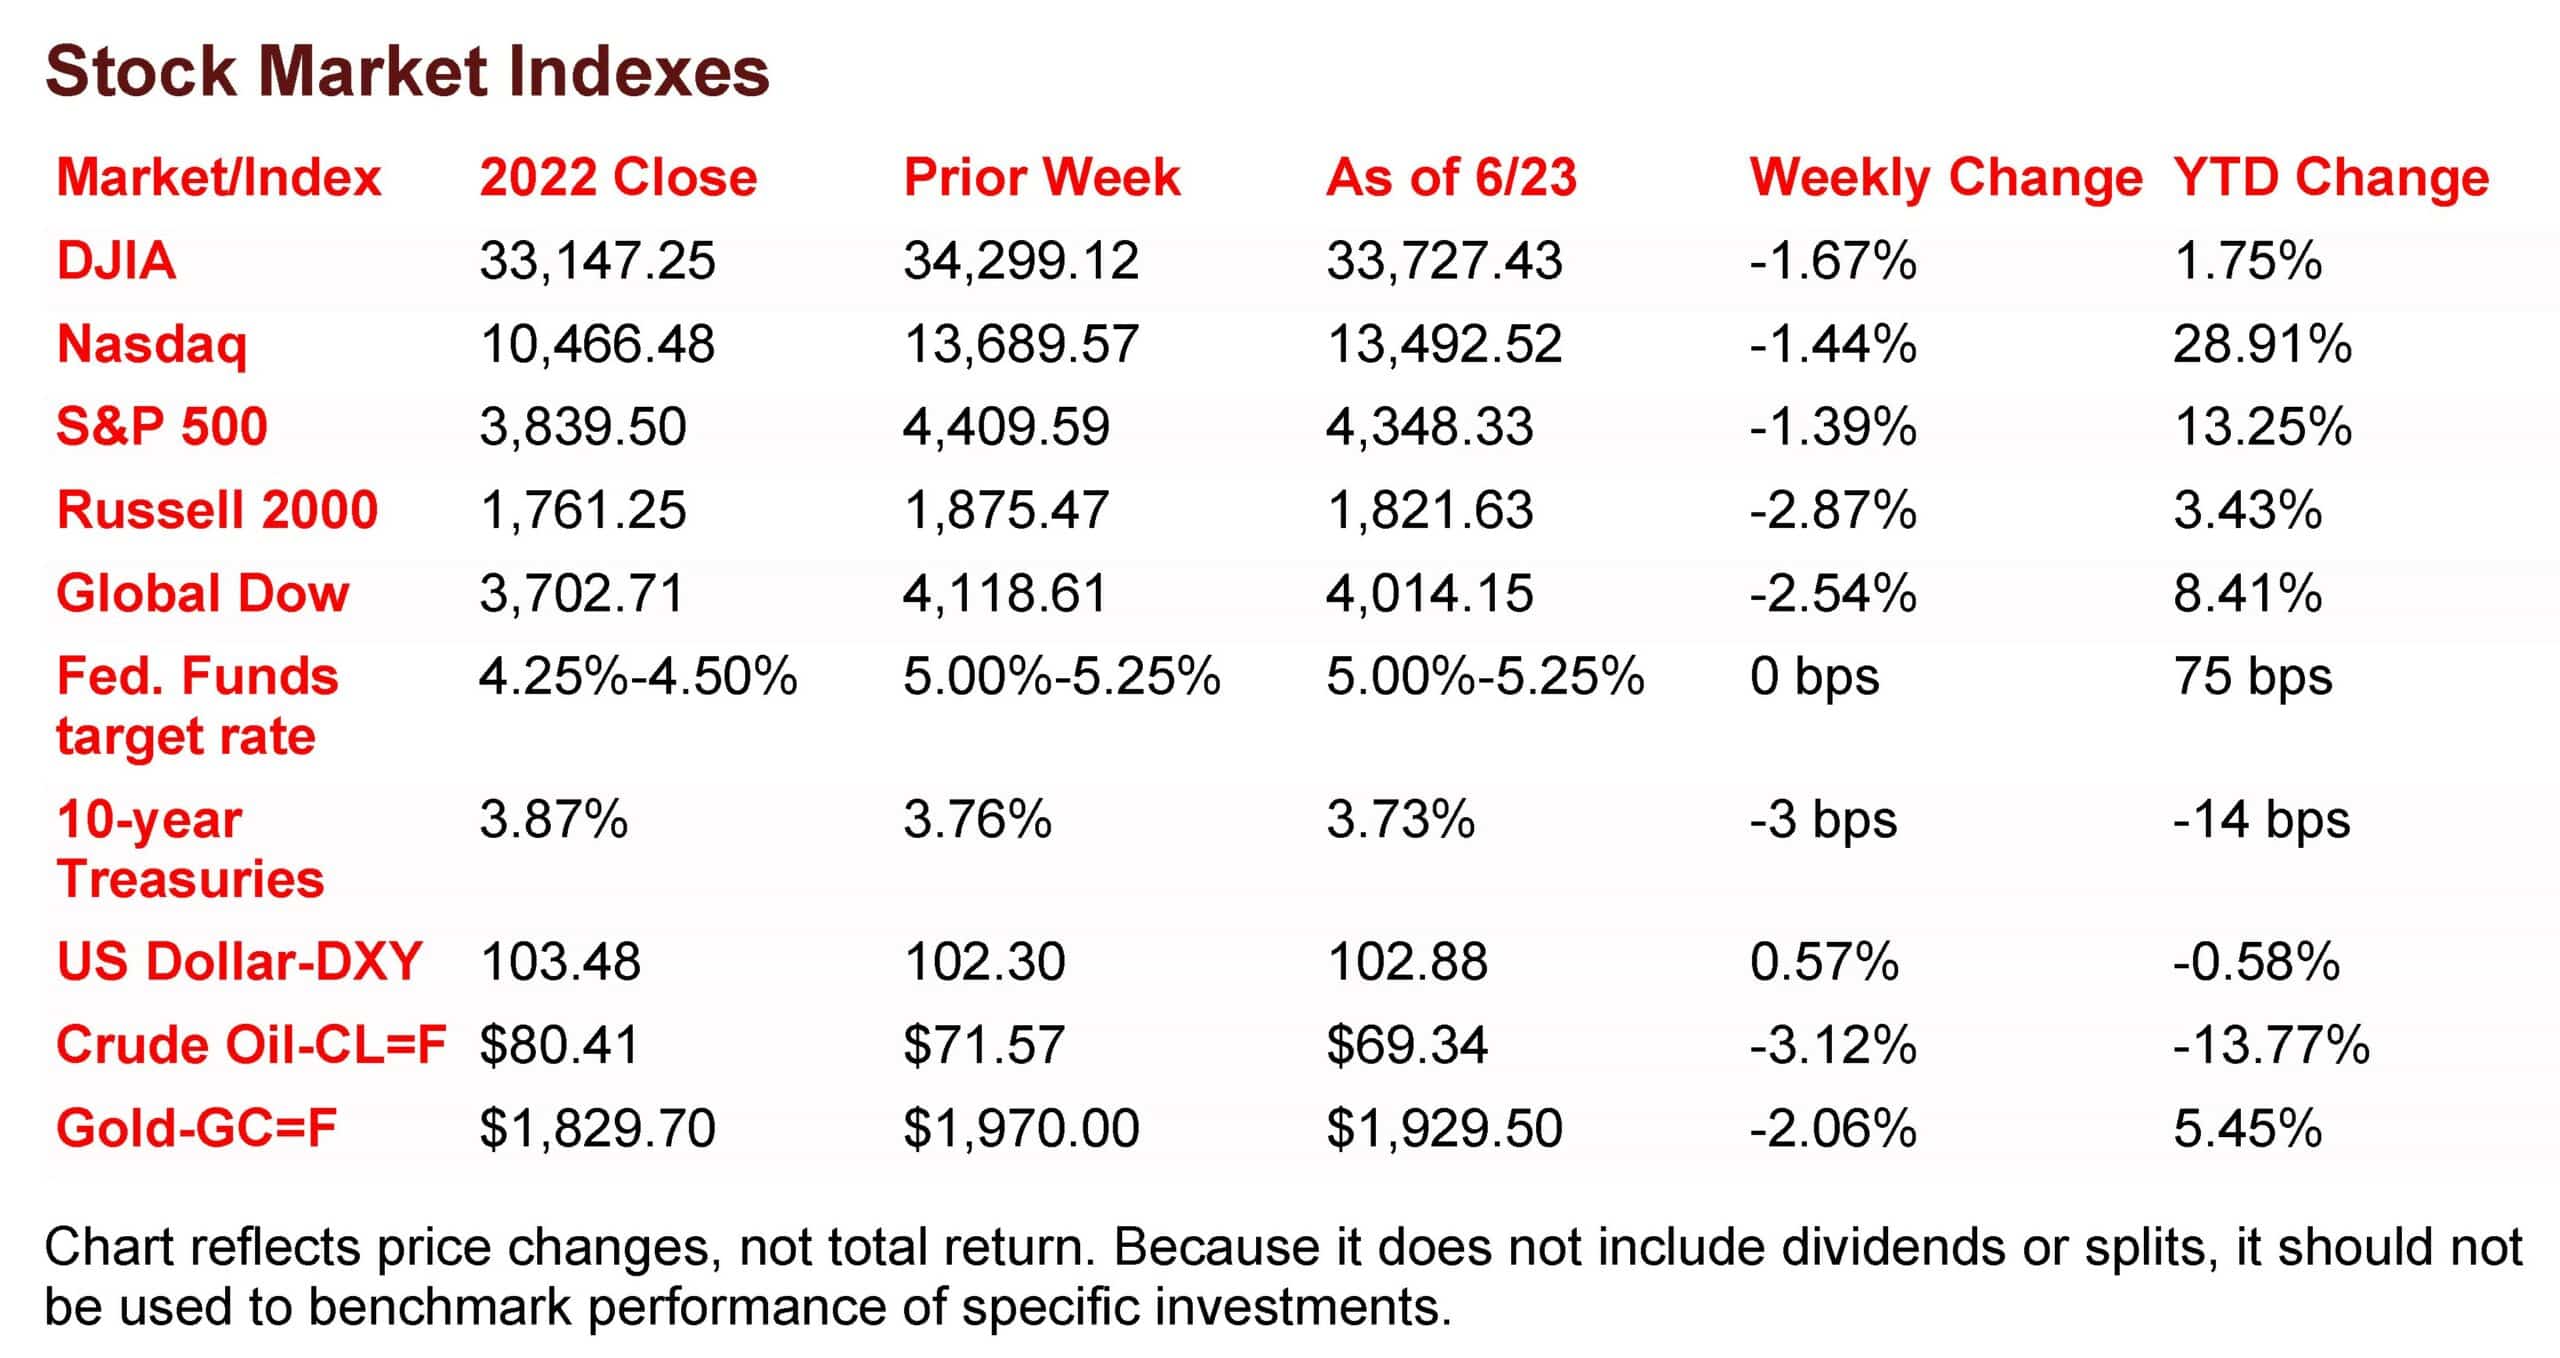
Recession fears caused a downturn in the stock market, with all benchmark indexes closing lower, except for Nasdaq and S&P 500 on Thursday. The causes included rising interest rates, slowing economic growth, and inflation in Europe and Asia. The dollar gained slightly while gold and crude oil prices declined. In May, residential building permits, housing starts, and completions increased, but existing home sales rose slightly with a higher median price. Gasoline prices decreased slightly, while new claims for unemployment insurance were at 264,000.
The Markets (as of market close June 23, 2023)
Recession fears sent stocks lower during the holiday-shortened week. Each of the benchmark indexes listed here closed in the red, with the small caps of the Russell 2000 and the Global Dow losing over 2.50%. The downturn ended a three-week rally for the Dow, a five-week winning streak for the S&P 500, and an eight-week surge by the Nasdaq. Concerns about rising interest rates and slowing economic growth weighed on equities. Rising inflation in Europe and Asia prompted more interest rate hikes by many central banks, which also dampened market growth. Ten-year Treasury yields dipped lower, while the dollar eked out a gain. Gold prices declined for the second straight week. Crude oil prices declined on fears of waning demand.
Wall Street ended last Tuesday lower as investors awaited House testimony from Federal Reserve Chair Jerome Powell, hoping to glean any clues as to the prospects of further interest rate hikes. Each of the benchmark indexes listed here closed the session lower, with the Dow falling 0.7%, followed by the Global Dow (-0.6%), the S&P 500 (-0.5%), the Russell 2000 (-0.4%), and the Nasdaq (-0.2%). Crude oil prices slid 1.2% to close at around $70.94 per barrel amid concerns over weakening demand. Ten-year Treasury yields declined 4.0 basis points to settle at 3.72%. The dollar was flat, while gold prices dipped lower.
Last Wednesday saw stocks fall for the second straight session, following Federal Reserve Chair Jerome Powell’s intimation that interest rate increases will continue until inflation recedes to the Fed’s 2.0% target rate. Tech shares slid lower, dragging the Nasdaq down 1.2%. The S&P 500 fell 0.5%, the Dow dipped 0.3%, the Russell 2000 declined 0.2%, and the Global Dow ended where it began. Crude oil prices rebounded, rising nearly 2.0% to reach $72.58 per barrel. Ten-year Treasury yields fell 0.6 basis points to close at 3.72%. The dollar dropped nearly 0.5%, while gold prices fell 0.2%.
Stocks ended last Thursday with mixed results. The Nasdaq (1.0%) and the S&P 500 (0.4%) posted gains, buoyed by rallies in consumer discretionary, information technology, and communications. The small caps of the Russell 2000 (-0.9%) and the Global Dow (-0.4%) slid lower. The Dow was flat. Several central banks, including the Bank of England, raised interest rates, following a spike in inflation data. Ten-year Treasury yields closed at 3.79%, up 7.6 basis points from the previous day. Crude oil prices plunged 4.3%, to $69.38 per barrel, impacted by the aforementioned interest rate hikes. The dollar rose 0.3%, while gold prices fell 1.1%.
Last Friday saw stocks close lower, with each of the benchmark indexes listed here losing value. The Russell 2000 fell the furthest, dropping 1.4%, followed by the Global Dow (-1.1%), the Nasdaq (-1.0%), the S&P 500 (-0.8%), and the Dow (-0.7%). Ten-year Treasury yields slipped 6.0 basis points, settling at 3.73%. Crude oil prices declined 0.4% to end the day at about $69.34 per barrel. The dollar and gold prices advanced.
 Last Week’s Economic News
The number of residential building permits issued in May rose 5.2% over the previous month’s total, but was 12.7% below the May 2022 rate. Issued building permits for single-family construction in May rose 4.8% above the April figure. Housing starts increased 21.7% in May and are 5.7% above the May 2022 rate. Single-family housing starts jumped 18.5% in May. The overall rise in housing starts was driven by construction in the Midwest, which saw the number of housing starts increase 66.9% in May. Lastly, housing completions in May were 9.5% above the April total. Single-family housing completions were 3.9% above April’s pace.
Existing home sales inched up 0.2% in May from April, but were down 20.4% from May 2022. According to the latest report from the National Association of REALTORS®, rising mortgage rates and lower inventory have impacted sales of existing homes. Total housing inventory sat at a three-month supply at the current sales pace, up from 2.9 months in April. The median existing-home price for all housing types in May was $396,100, up from $385,900 in April, but down from $408,600 in May 2022. Sales of single-family homes dipped 0.3% in May and 20.0% from May 2022. The median existing single-family home price was $401,100 in May, 2.8% above the April figure ($390,200), but down 3.4% from May 2022 ($415,400).
The national average retail price for regular gasoline was $3.577 per gallon on June 19, $0.018 per gallon lower than the prior week’s price and $1.385 less than a year ago. Also, as of June 19, the East Coast price decreased $0.013 to $3.419 per gallon; the Midwest price fell $0.024 to $3.489 per gallon; the Gulf Coast price declined $0.036 to $3.109 per gallon; the Rocky Mountain price increased $0.014 to $3.721 per gallon; and the West Coast price dipped $0.015 to $4.569 per gallon.
For the week ended June 17, there were 264,000 new claims for unemployment insurance, unchanged from the previous week’s level, which was revised up by 2,000. According to the Department of Labor, the advance rate for insured unemployment claims for the week ended June 10 was 1.2%, unchanged from the previous week’s rate. The advance number of those receiving unemployment insurance benefits during the week ended June 10 was 1,759,000, a decrease of 13,000 from the previous week’s level, which was revised down by 3,000. States and territories with the highest insured unemployment rates for the week ended June 3 were California (2.3%), New Jersey (2.1%), Massachusetts (1.9%), New York (1.6%), Oregon (1.6%), Puerto Rico (1.6%), Rhode Island (1.5%), Washington (1.5%), Illinois (1.4%), Nevada (1.4%), and Pennsylvania (1.4%). The largest increases in initial claims for unemployment insurance for the week ended June 10 were in Texas (+7,327), Minnesota (+3,653), Pennsylvania (+3,455), Georgia (+1,918), and Indiana (+1,591), while the largest decreases were in Tennessee (-716), Massachusetts (-655), Idaho (-313), and Iowa (-200).
Eye on the Week Ahead
There’s plenty of important economic data available this week, including two of the more important economic indicators; gross domestic product and the report on personal income and outlays. The third and final iteration of first-quarter GDP is released this week. The latest data showed the economy advanced, which might alleviate some recession fears, at a rate of 1.3%. Also, the report on personal income and outlays includes two important sub-categories: personal consumption expenditures and the personal consumption expenditures price index. Consumer spending rose 0.8% in April, while consumer prices for goods and services increased 0.4%.
Key Dates/Data Releases
- 6/27: Durable goods orders, new home sales
- 6/28: International trade in goods
- 6/28: GDP
- 6/29: Personal income and outlays
Scarlet Oak Financial Services can be reached at 800.871.1219 or contact us here. Click here to sign up for our weekly newsletter with the latest economic news.
Data sources:
Economic: Based on data from U.S. Bureau of Labor Statistics (unemployment, inflation);
U.S. Department of Commerce (GDP, corporate profits, retail sales, housing); S&P/Case-Shiller 20-City Composite Index (home prices); Institute for Supply Management (manufacturing/services). Performance: Based on data reported in WSJ Market Data Center (indexes); U.S. Treasury (Treasury yields); U.S. Energy Information Administration/Bloomberg.com Market Data (oil spot price, WTI, Cushing, OK); www.goldprice.org (spot gold/silver); Oanda/FX Street (currency exchange rates). News items are based on reports from multiple commonly available international news sources (i.e., wire services) and are independently verified when necessary with secondary sources such as government agencies, corporate press releases, or trade organizations. All information is based on sources deemed reliable, but no warranty or guarantee is made as to its accuracy or completeness. Neither the information nor any opinion expressed herein constitutes a solicitation for the purchase or sale of any securities, and should not be relied on as financial advice. Forecasts are based on current conditions, subject to change, and may not come to pass. U.S. Treasury securities are guaranteed by the federal government as to the timely payment of principal and interest. The principal value of Treasury securities and other bonds fluctuates with market conditions. Bonds are subject to inflation, interest-rate, and credit risks. As interest rates rise, bond prices typically fall. A bond sold or redeemed prior to maturity may be subject to loss. Past performance is no guarantee of future results. All investing involves risk, including the potential loss of principal, and there can be no guarantee that any investing strategy will be successful.
The Dow Jones Industrial Average (DJIA) is a price-weighted index composed of 30 widely traded blue-chip U.S. common stocks. The S&P 500 is a market-cap weighted index composed of the common stocks of 500 largest, publicly traded companies in leading industries of the U.S. economy. The NASDAQ Composite Index is a market-value weighted index of all common stocks listed on the NASDAQ stock exchange. The Russell 2000 is a market-cap weighted index composed of 2,000 U.S. small-cap common stocks. The Global Dow is an equally weighted index of 150 widely traded blue-chip common stocks worldwide. The U.S. Dollar Index is a geometrically weighted index of the value of the U.S. dollar relative to six foreign currencies. Market indexes listed are unmanaged and are not available for direct investment.
Broadridge Investor Communication Solutions, Inc. prepared this material for use by Scarlet Oak Financial Services.
Broadridge Investor Communication Solutions, Inc. does not provide investment, tax, legal, or retirement advice or recommendations. The information presented here is not specific to any individual’s personal circumstances. To the extent that this material concerns tax matters, it is not intended or written to be used, and cannot be used, by a taxpayer for the purpose of avoiding penalties that may be imposed by law. Each taxpayer should seek independent advice from a tax professional based on individual circumstances. Scarlet Oak Financial Services provide these materials for general information and educational purposes based upon publicly available information from sources believed to be reliable — we cannot assure the accuracy or completeness of these materials. The information in these materials may change at any time and without notice.
