
Client Update
First Quarter 2023
What a difference a year makes! The start to 2023 had much better performance than the start of 2022. Major stock and bond markets saw prices appreciate. This rebound was strongest in the assets that were hardest hit in 2022, most notably growth and tech stocks. Also, this time a year ago, the yield on short-term government bonds was barely above 0, where we see rates at nearly 5% now.
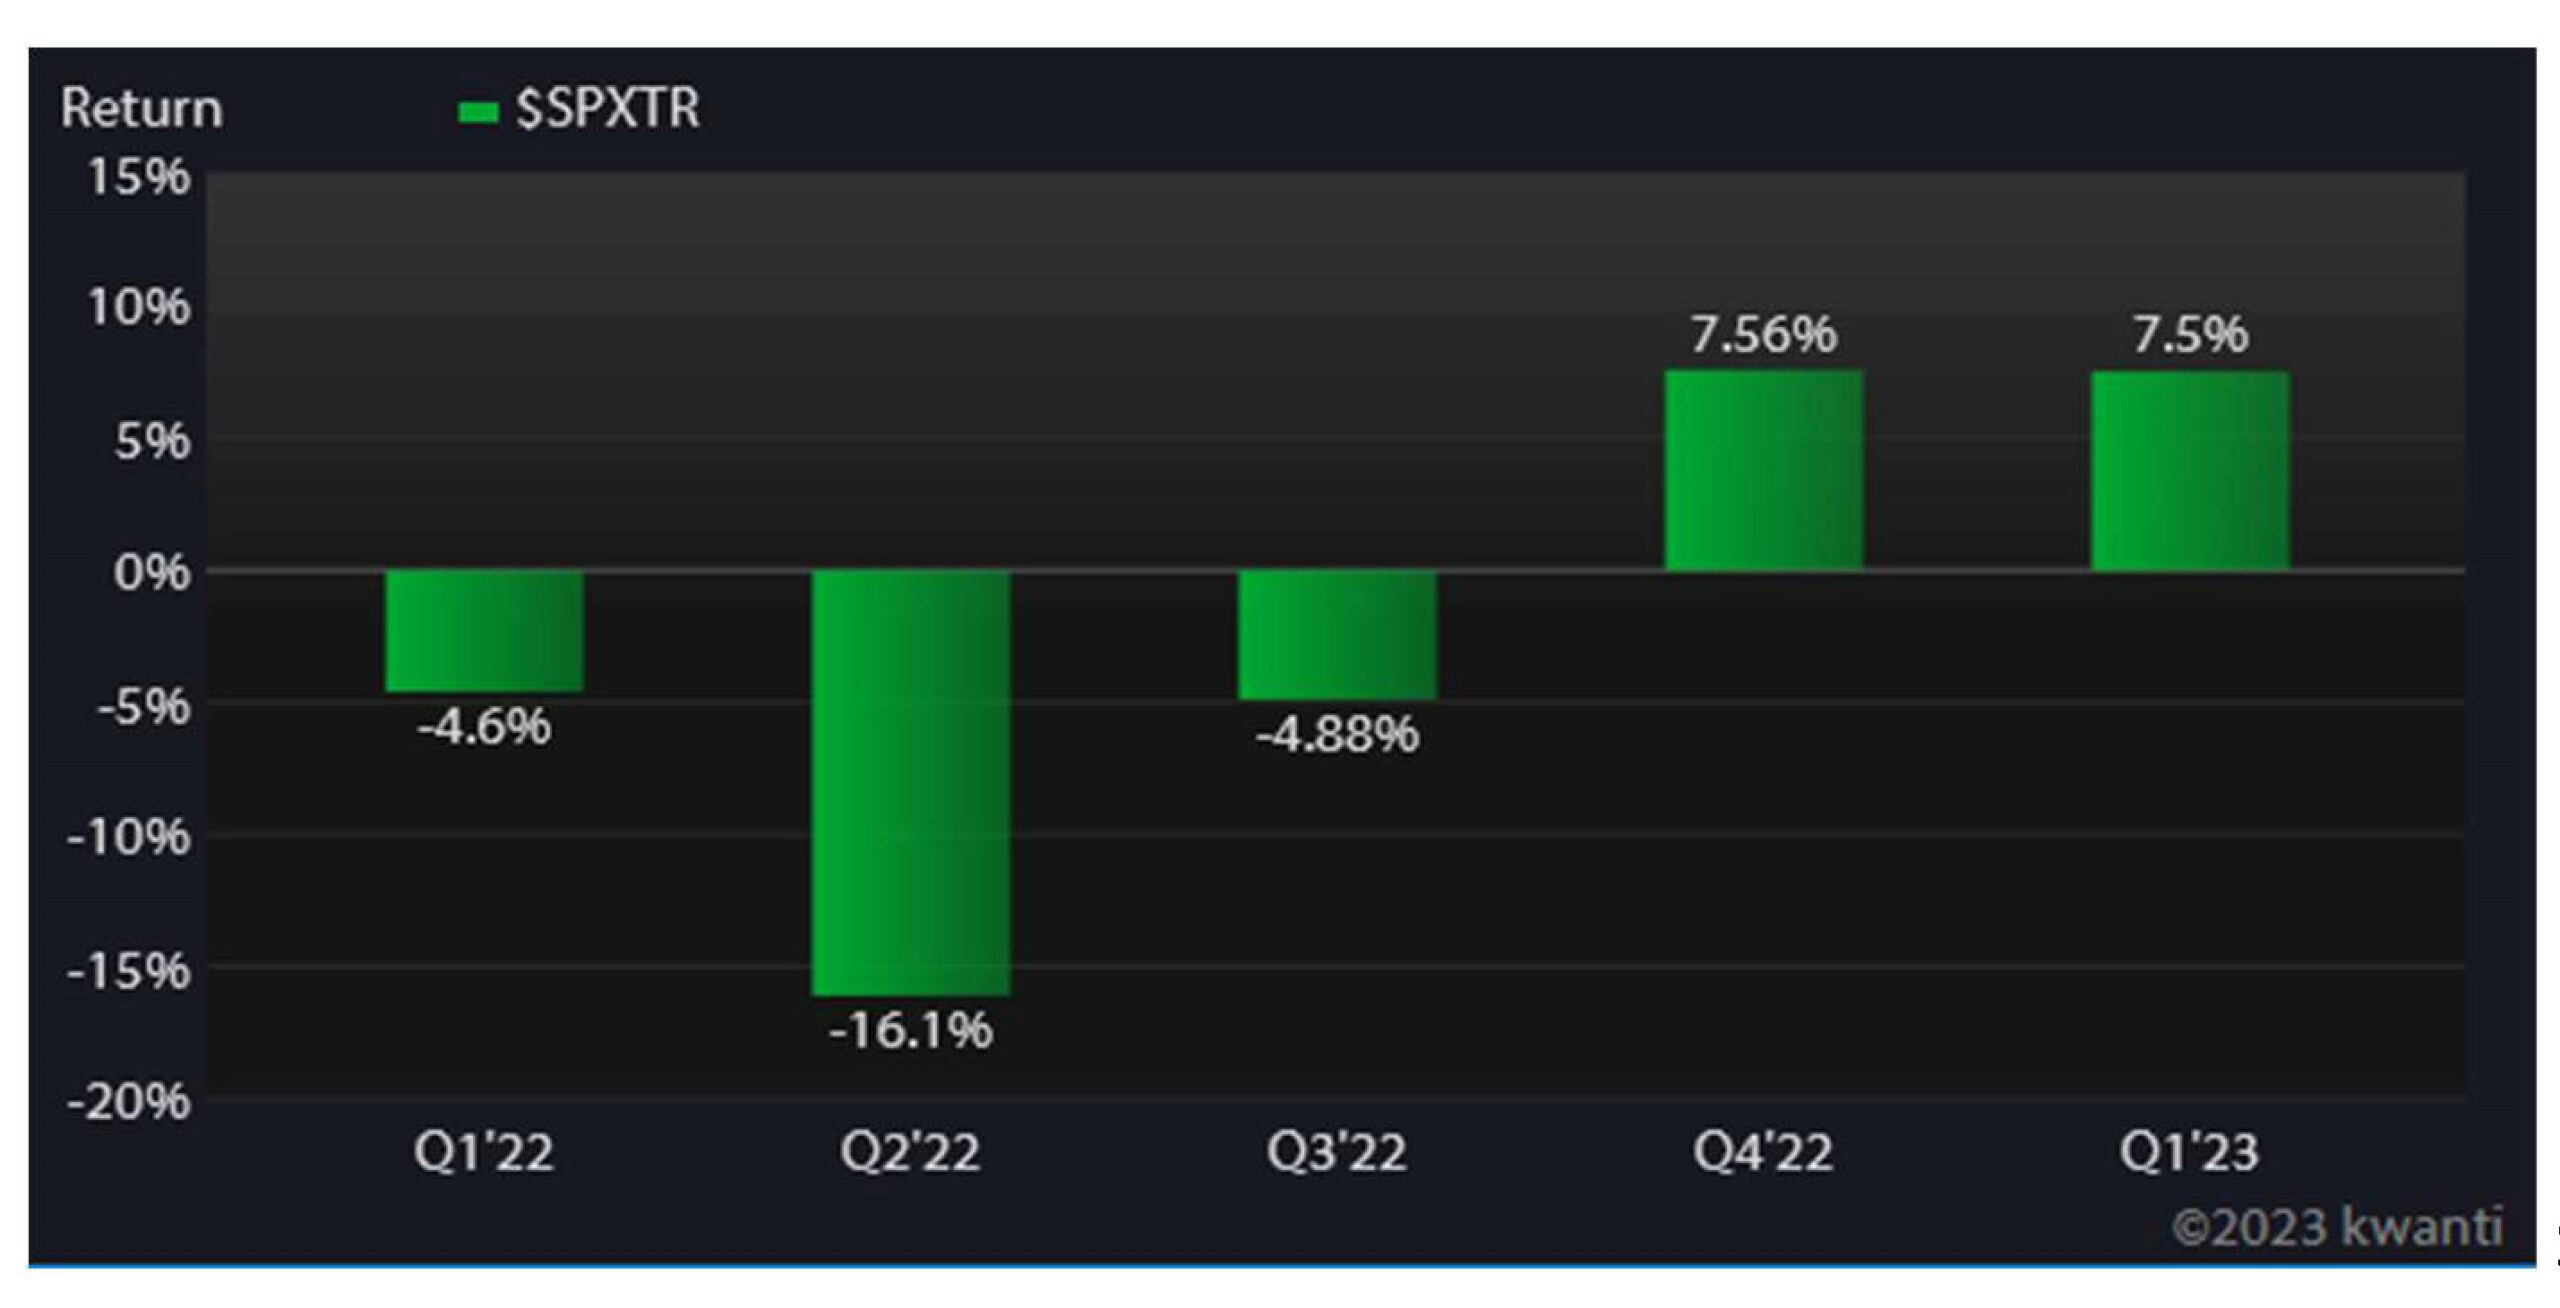 S&P500 Total Return
Bank Failures
While bank failures dominated headlines, this seems to be isolated to a few banks that made very poor management decisions. Amongst other issues, Silicon Valley Bank failed due to poor diversification. Their reserves were heavily weighted in long-term bonds, without enough short-term bonds. As a result of limited diversification, their client base was heavily concentrated in one sector of the economy with a small number of very large accounts.
We are actively monitoring the situation. While banks are a segment of the stock strategies we use, they are not a large portion, and did not prompt immediate action. Banks can affect other segments of the economy, and we are considering how those scenarios could unfold.
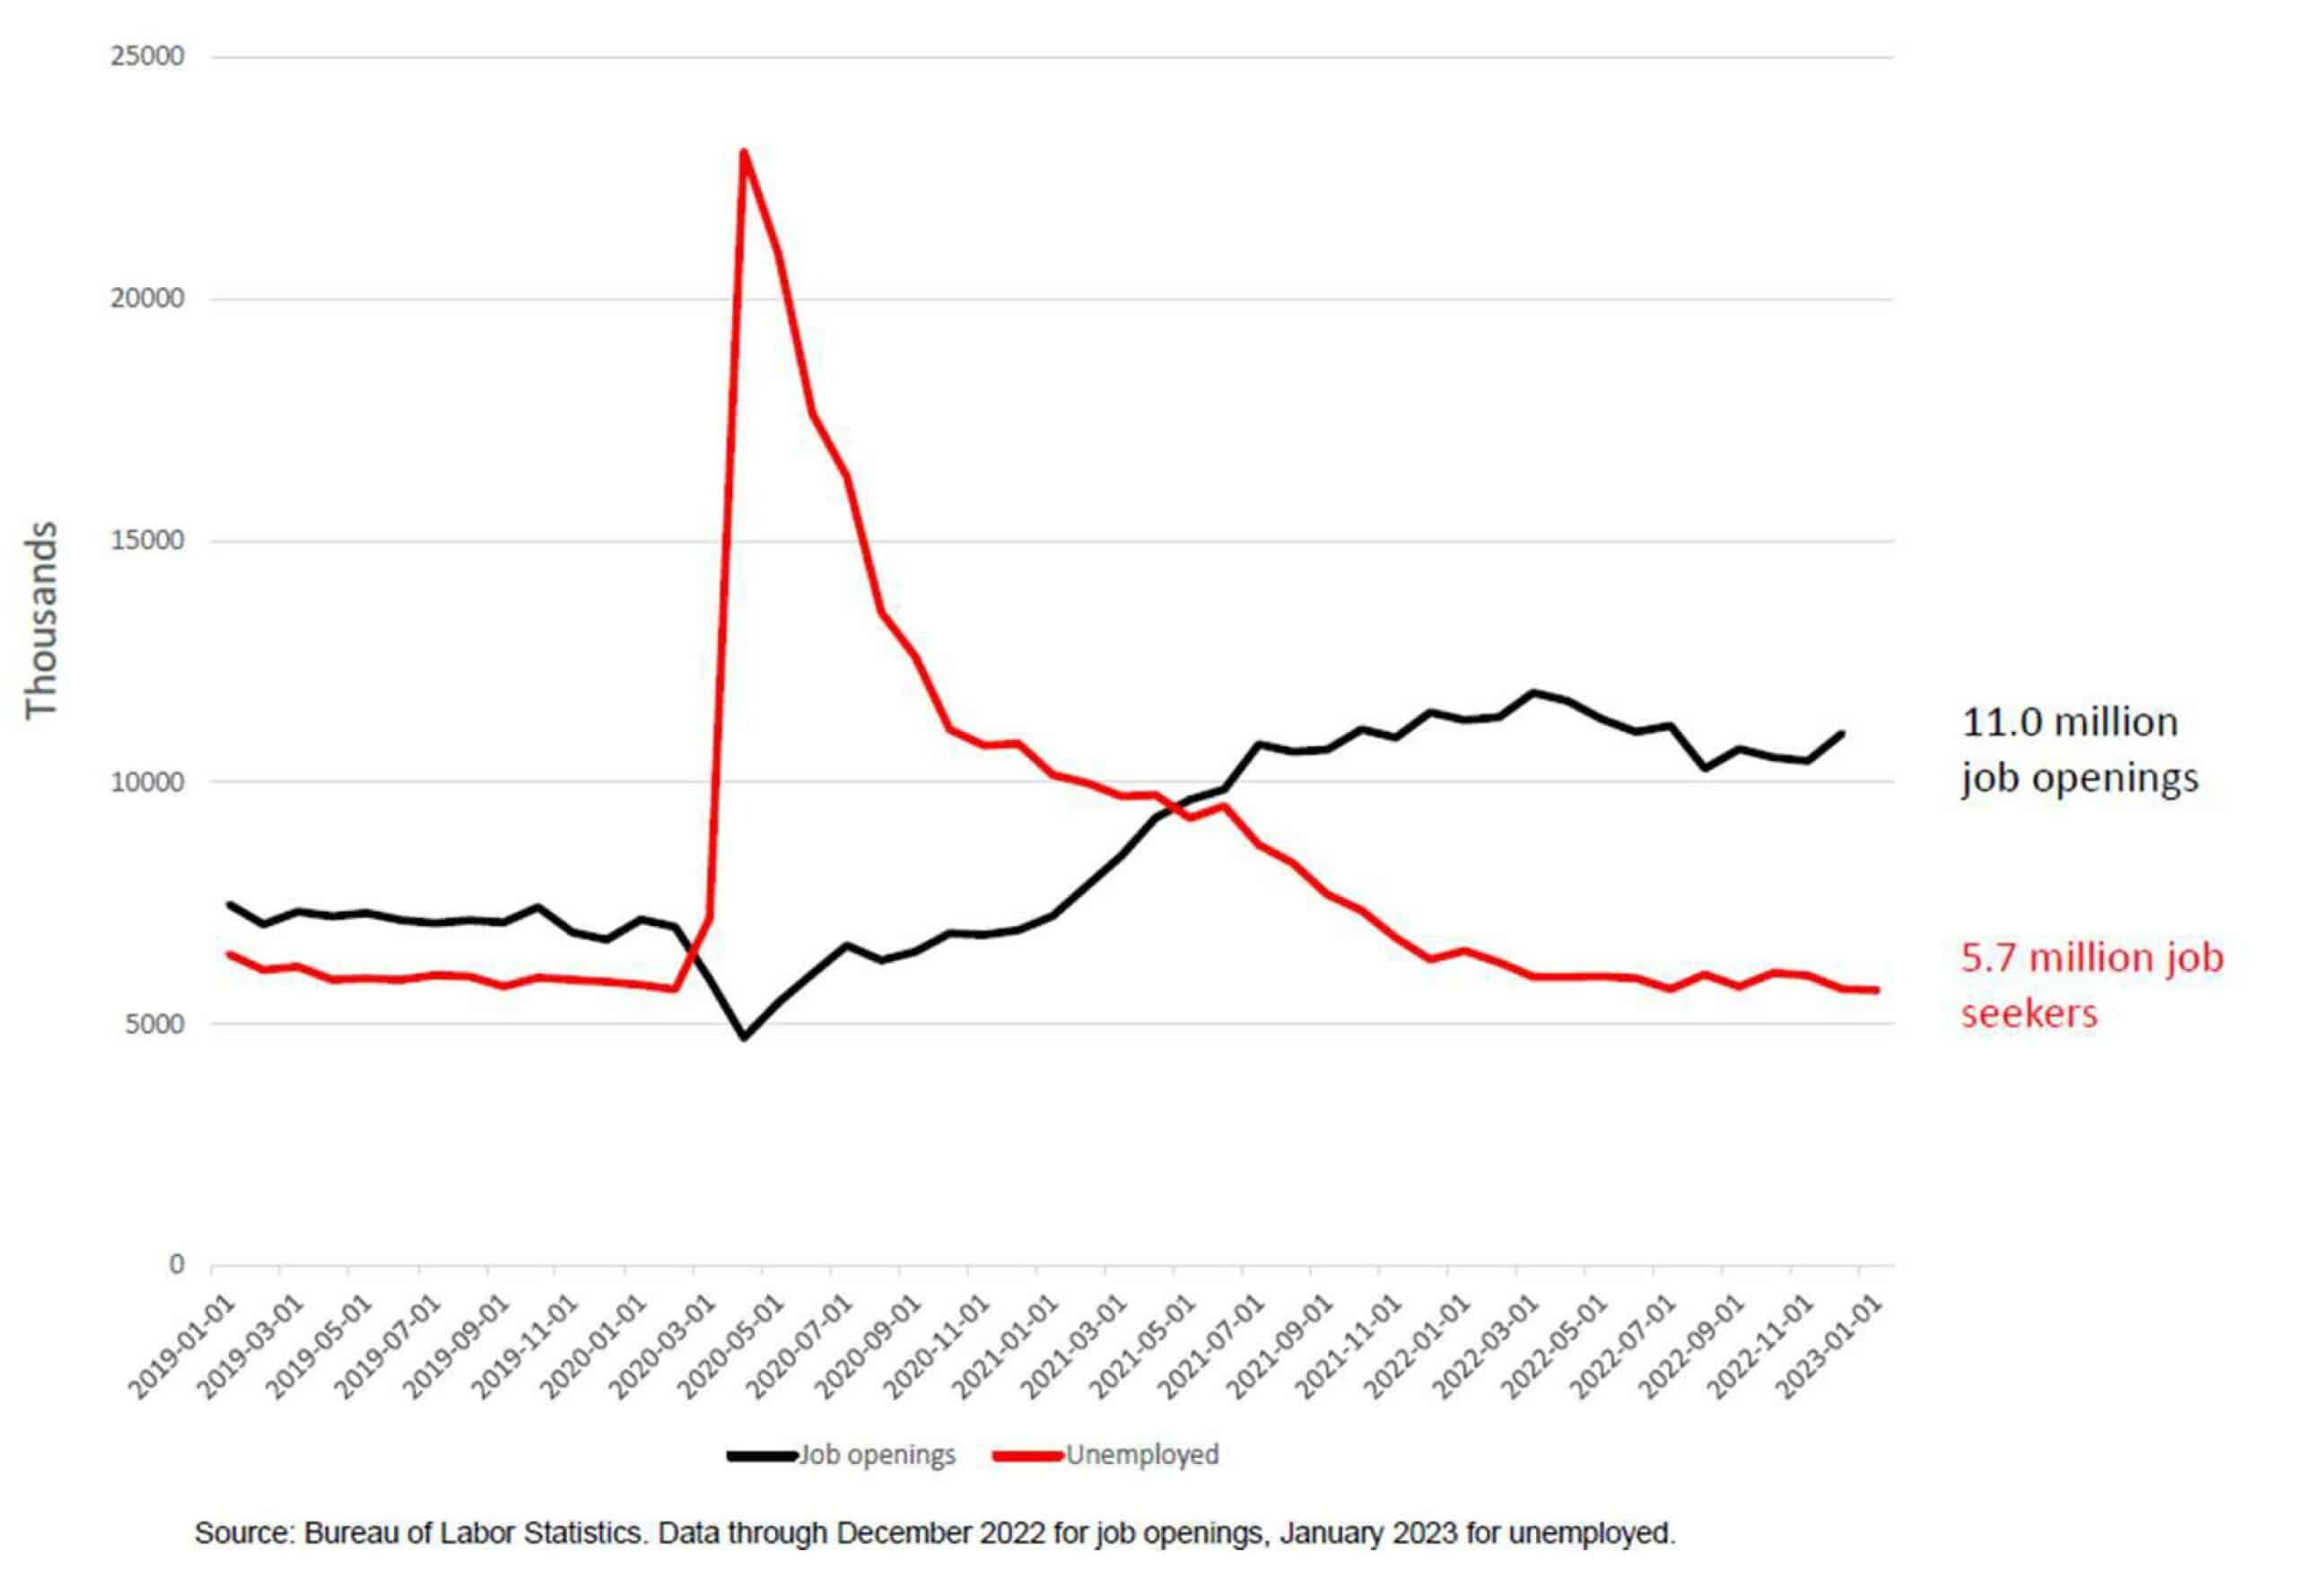
Labor
The demand for labor reached nearly 2 vacant positions for every job seeker in Q1. Despite the rhetoric of recession, we are seeing very little slowdown in hiring.
 Inflation
That doesn’t mean we don’t feel squeezed as inflation seems to be moderating after a wild upswing in 2022. We expect prices to stay elevated, but the increases could slow down. The Fed has pushed interest rates up to combat inflation, but this only addresses half of the equation. Raising interest rates can help slow the demand side of inflation. The idea is that higher borrowing costs will slow economic growth.
This does not address the supply side of inflation. Making stuff in the USA costs more than abroad. Raw materials are expensive. Also, we don’t have enough people to fill all the jobs, as noted above. This creates competition for labor, rising wages, and higher costs for goods and services.
Ultimately, this could lead to a new strengthening middle class, something we have not experienced over the past few decades. In the short-term, we should expect to find some bumps in the road.
As an investment manager, we see this as another great reason to stay diversified and focus on long-term investment themes. There will always be a darling stock name that skyrockets, many of which come plummeting back down. By investing in well-diversified strategies, we reduce the chances of a poor outcome.
We design our investment strategies with a different approach, holding investments that are targeted to the timeframe of your financial plan.
Scarlet Oak Financial Services can be reached at 800.871.1219 or contact us here. Click here to sign up for our weekly newsletter with the latest economic news.
Disclosures
This material represents an assessment of the market and economic environment at a specific point in time and is not intended to be a forecast of future events, or a guarantee of future results. Forward-looking statements are subject to certain risks and uncertainties. Actual results, performance, or achievements may differ materially from those expressed or implied. Information is based on data gathered from what we believe are reliable sources. It is not guaranteed as to accuracy, does not purport to be complete and is not intended to be used as a primary basis for investment decisions. It should also not be construed as advice meeting the particular investment needs of any investor.
‘Past performance does not guarantee future results. Investing involves risk, including the loss of principal.
‘The Standard & Poor’s 500 (S&P 500) is an unmanaged group of securities considered to be representative of the stock market in general. It is a market value weighted index with each stock’s weight in the index proportionate to its market value.
‘Neither Asset Allocation nor Diversification guarantee a profit or protect against a loss in a declining market. They are methods used to help manage investment risk.
Please consider the investment objectives, risks, charges, and expenses carefully before investing. The prospectus, which contains this and other information about the investment company, can be obtained directly from the Fund Company or your financial professional. Be sure to read the prospectus carefully before deciding whether to invest.
