![Fed Rate Cut Expectations Push Markets [09/15/2025]](https://scarletoakfs.com/wp-content/uploads/2025/09/Fed-Rate-Cut-Expectations-Push-Markets-Header.jpg)
Market Week: September 15, 2025
Market Recap:
Fed rate cut expectations push markets, sending the NASDAQ to a record high, while falling Treasury yields boosted housing and stocks. August CPI rose 0.4% on higher shelter, food, and energy costs, while producer prices dipped 0.1% and core inflation stayed firm. The federal deficit widened to $345 billion, unemployment claims reached their highest level since 2021, and gas prices exhibited mixed regional trends. Markets now await a likely 25-point rate cut and key data on retail sales, industrial production, and housing starts.
The Markets (as of market close September 12, 2025)
Wall Street enjoyed a positive performance last week, fueled by growing expectations of a Federal Reserve interest rate cut. Each of the benchmark indexes listed here finished the week with gains. The NASDAQ recorded a fresh record high as tech shares continued to lead the market. Investors apparently saw the economy slowing just enough to warrant an interest rate cut but not so much as to trigger a recession. Ten-year Treasury bond yields rose last Friday, recovering some of the sharp losses from earlier in the week. The recent decline in yields, in anticipation of the aforementioned rate cut, has been a positive for the housing sector (with mortgage rates declining) and for stocks. Crude oil prices ticked higher as Ukrainian drone strikes raised concerns over potential disruptions to Russian oil exports.
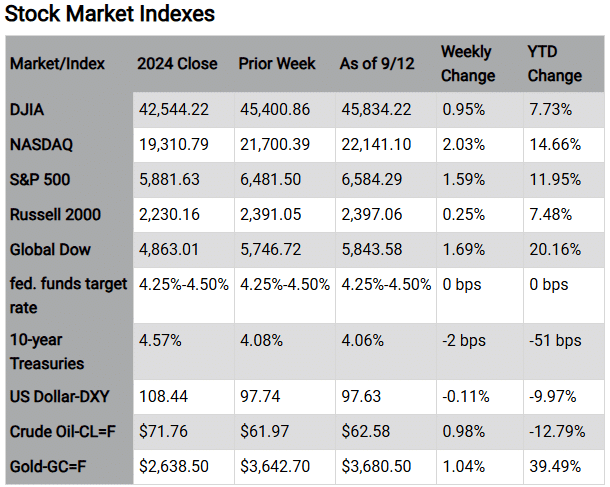
Chart reflects price changes, not total return. Because it does not include dividends or splits, it should not be used to benchmark performance of specific investments.
Last Week’s Economic News
The Consumer Price Index (CPI) increased 0.4% in August after rising 0.2% in July. For the 12 months ended in August, the CPI increased 2.9% after rising 2.7% over the 12 months ended in July. The index for shelter rose 0.4% in August and was the largest factor in the overall monthly increase. Food prices increased 0.5% over the month as food at home prices rose 0.6%, while prices for food away from home increased 0.3%. Prices for energy rose 0.7% in August as gasoline prices increased 1.9% over the month. Prices less food and energy (core prices) rose 0.3% in August, the same increase as in July.
Producer prices edged down 0.1% in August after increasing 0.7% the previous month. Over the last 12 months, producer prices have risen 2.6%. The August decrease in producer prices was attributable to a 0.2% decline in prices for services. In contrast, prices for goods inched up 0.1%. Prices less foods, energy, and trade services rose 0.3% in August, marking the fourth consecutive monthly increase. For the 12 months ended in August, prices less foods, energy, and trade services moved up 2.8%, the largest 12-month advance since climbing 3.5% in March 2025.
The monthly Treasury budget showed a deficit of $345 billion in August, well above the July deficit of $291 billion. Outlays for military active duty and retirement, veterans’ benefits, Supplemental Security Income, and Medicare payments to health maintenance organizations and prescription drug plans accelerated into August because September 1, 2025, the normal payment date, fell on a nonbusiness day. For the 11 months of the current fiscal year, the deficit sits at $1,973 billion, which is higher than the deficit of $1,897 billion over the comparable period last fiscal year.
The national average retail price for regular gasoline was $3.192 per gallon on September 8, $0.015 per gallon above the prior week’s price but $0.044 per gallon less than a year ago. Also, as of September 8, the East Coast price increased $0.051 to $3.063 per gallon; the Midwest price declined $0.033 to $3.055 per gallon; the Gulf Coast price decreased $0.032 to $2.733 per gallon; the Rocky Mountain price climbed $0.057 to $3.240 per gallon; and the West Coast price rose $0.046 to $4.194 per gallon.
For the week ended September 6, there were 263,000 new claims for unemployment insurance, an increase of 27,000 from the previous week’s level, which was revised down by 1,000. This is the highest level for initial claims since October 23, 2021, when it was 268,000. According to the Department of Labor, the advance rate for insured unemployment claims for the week ended August 30 was 1.3%, unchanged from the previous week’s rate. The advance number of those receiving unemployment insurance benefits during the week ended August 30 was 1,939,000, unchanged from the previous week’s level, which was revised down by 1,000. States and territories with the highest insured unemployment rates for the week ended August 23 were New Jersey (2.8%), Rhode Island (2.5%), Massachusetts (2.2%), Washington (2.1%), California (2.0%), Connecticut (2.0%), Minnesota (2.0%), Puerto Rico (2.0%), the District of Columbia (1.9%), New York (1.8%), Oregon (1.8%), and Pennsylvania (1.8%). The largest increases in initial claims for unemployment insurance for the week ended August 30 were in Tennessee (+2,870), Connecticut (+2,270), New York (+1,683), Illinois (+1,331), and California (+982), while the largest decreases were in Kentucky (-2,833), Pennsylvania (-504), Florida (-456), Texas (-402), and Arizona (-329).
Eye on the Week Ahead
The Federal Open Market Committee holds its meeting this week, the outcome of which is expected to be a 25-basis-point cut in the federal funds target rate range.
Key Dates/Data Releases
- 9/16: Retail sales, import and export prices, industrial production
- 9/17: FOMC meeting statement, housing starts
Scarlet Oak Financial Services can be reached at 800.871.1219 or contact us here. Click here to sign up for our newsletter with the latest economic news.
Data sources: Economic: Based on data from U.S. Bureau of Labor Statistics (unemployment, inflation); U.S. Department of Commerce (GDP, corporate profits, retail sales, housing); S&P/Case-Shiller 20-City Composite Index (home prices); Institute for Supply Management (manufacturing/services). Performance: Based on data reported in WSJ Market Data Center (indexes); U.S. Treasury (Treasury yields); U.S. Energy Information Administration/Bloomberg.com Market Data (oil spot price, WTI, Cushing, OK); www.goldprice.org (spot gold/silver); Oanda/FX Street (currency exchange rates).
News items are based on reports from multiple commonly available international news sources (i.e., wire services) and are independently verified when necessary with secondary sources such as government agencies, corporate press releases, or trade organizations. All information is based on sources deemed reliable, but no warranty or guarantee is made as to its accuracy or completeness. Neither the information nor any opinion expressed herein constitutes a solicitation for the purchase or sale of any securities, and should not be relied on as financial advice.
Forecasts are based on current conditions, subject to change, and may not come to pass. U.S. Treasury securities are guaranteed by the federal government as to the timely payment of principal and interest. The principal value of Treasury securities and other bonds fluctuates with market conditions. Bonds are subject to inflation, interest-rate, and credit risks. As interest rates rise, bond prices typically fall. A bond sold or redeemed prior to maturity may be subject to loss. Past performance is no guarantee of future results. All investing involves risk, including the potential loss of principal, and there can be no guarantee that any investing strategy will be successful.
The Dow Jones Industrial Average (DJIA) is a price-weighted index composed of 30 widely traded blue-chip U.S. common stocks. The S&P 500 is a market-cap weighted index composed of the common stocks of 500 largest, publicly traded companies in leading industries of the U.S. economy. The NASDAQ Composite Index is a market-value weighted index of all common stocks listed on the Nasdaq stock exchange. The Russell 2000 is a market-cap weighted index composed of 2,000 U.S. small-cap common stocks. The Global Dow is an equally weighted index of 150 widely traded blue-chip common stocks worldwide. The U.S. Dollar Index is a geometrically weighted index of the value of the U.S. dollar relative to six foreign currencies. Market indexes listed are unmanaged and are not available for direct investment.
Broadridge Investor Communication Solutions, Inc. prepared this material for use by Scarlet Oak Financial Services.
Broadridge Investor Communication Solutions, Inc. does not provide investment, tax, legal, or retirement advice or recommendations. The information presented here is not specific to any individual’s personal circumstances. To the extent that this material concerns tax matters, it is not intended or written to be used, and cannot be used, by a taxpayer for the purpose of avoiding penalties that may be imposed by law. Each taxpayer should seek independent advice from a tax professional based on individual circumstances. Scarlet Oak Financial Services provide these materials for general information and educational purposes based upon publicly available information from sources believed to be reliable — we cannot assure the accuracy or completeness of these materials. The information in these materials may change at any time and without notice.
