
Market Week: May 15, 2023
Last Week’s Recap: Investors are anxious about debt ceiling negotiations, causing stocks to trend lower. Most S&P 500 companies’ first-quarter earnings are down 2.5% from last year, but 78% of companies have beaten expectations. Benchmark indexes are ahead of where they began this year, except for the Russell 2000. Debt ceiling negotiations continue this week as the June 1st deadline looms.
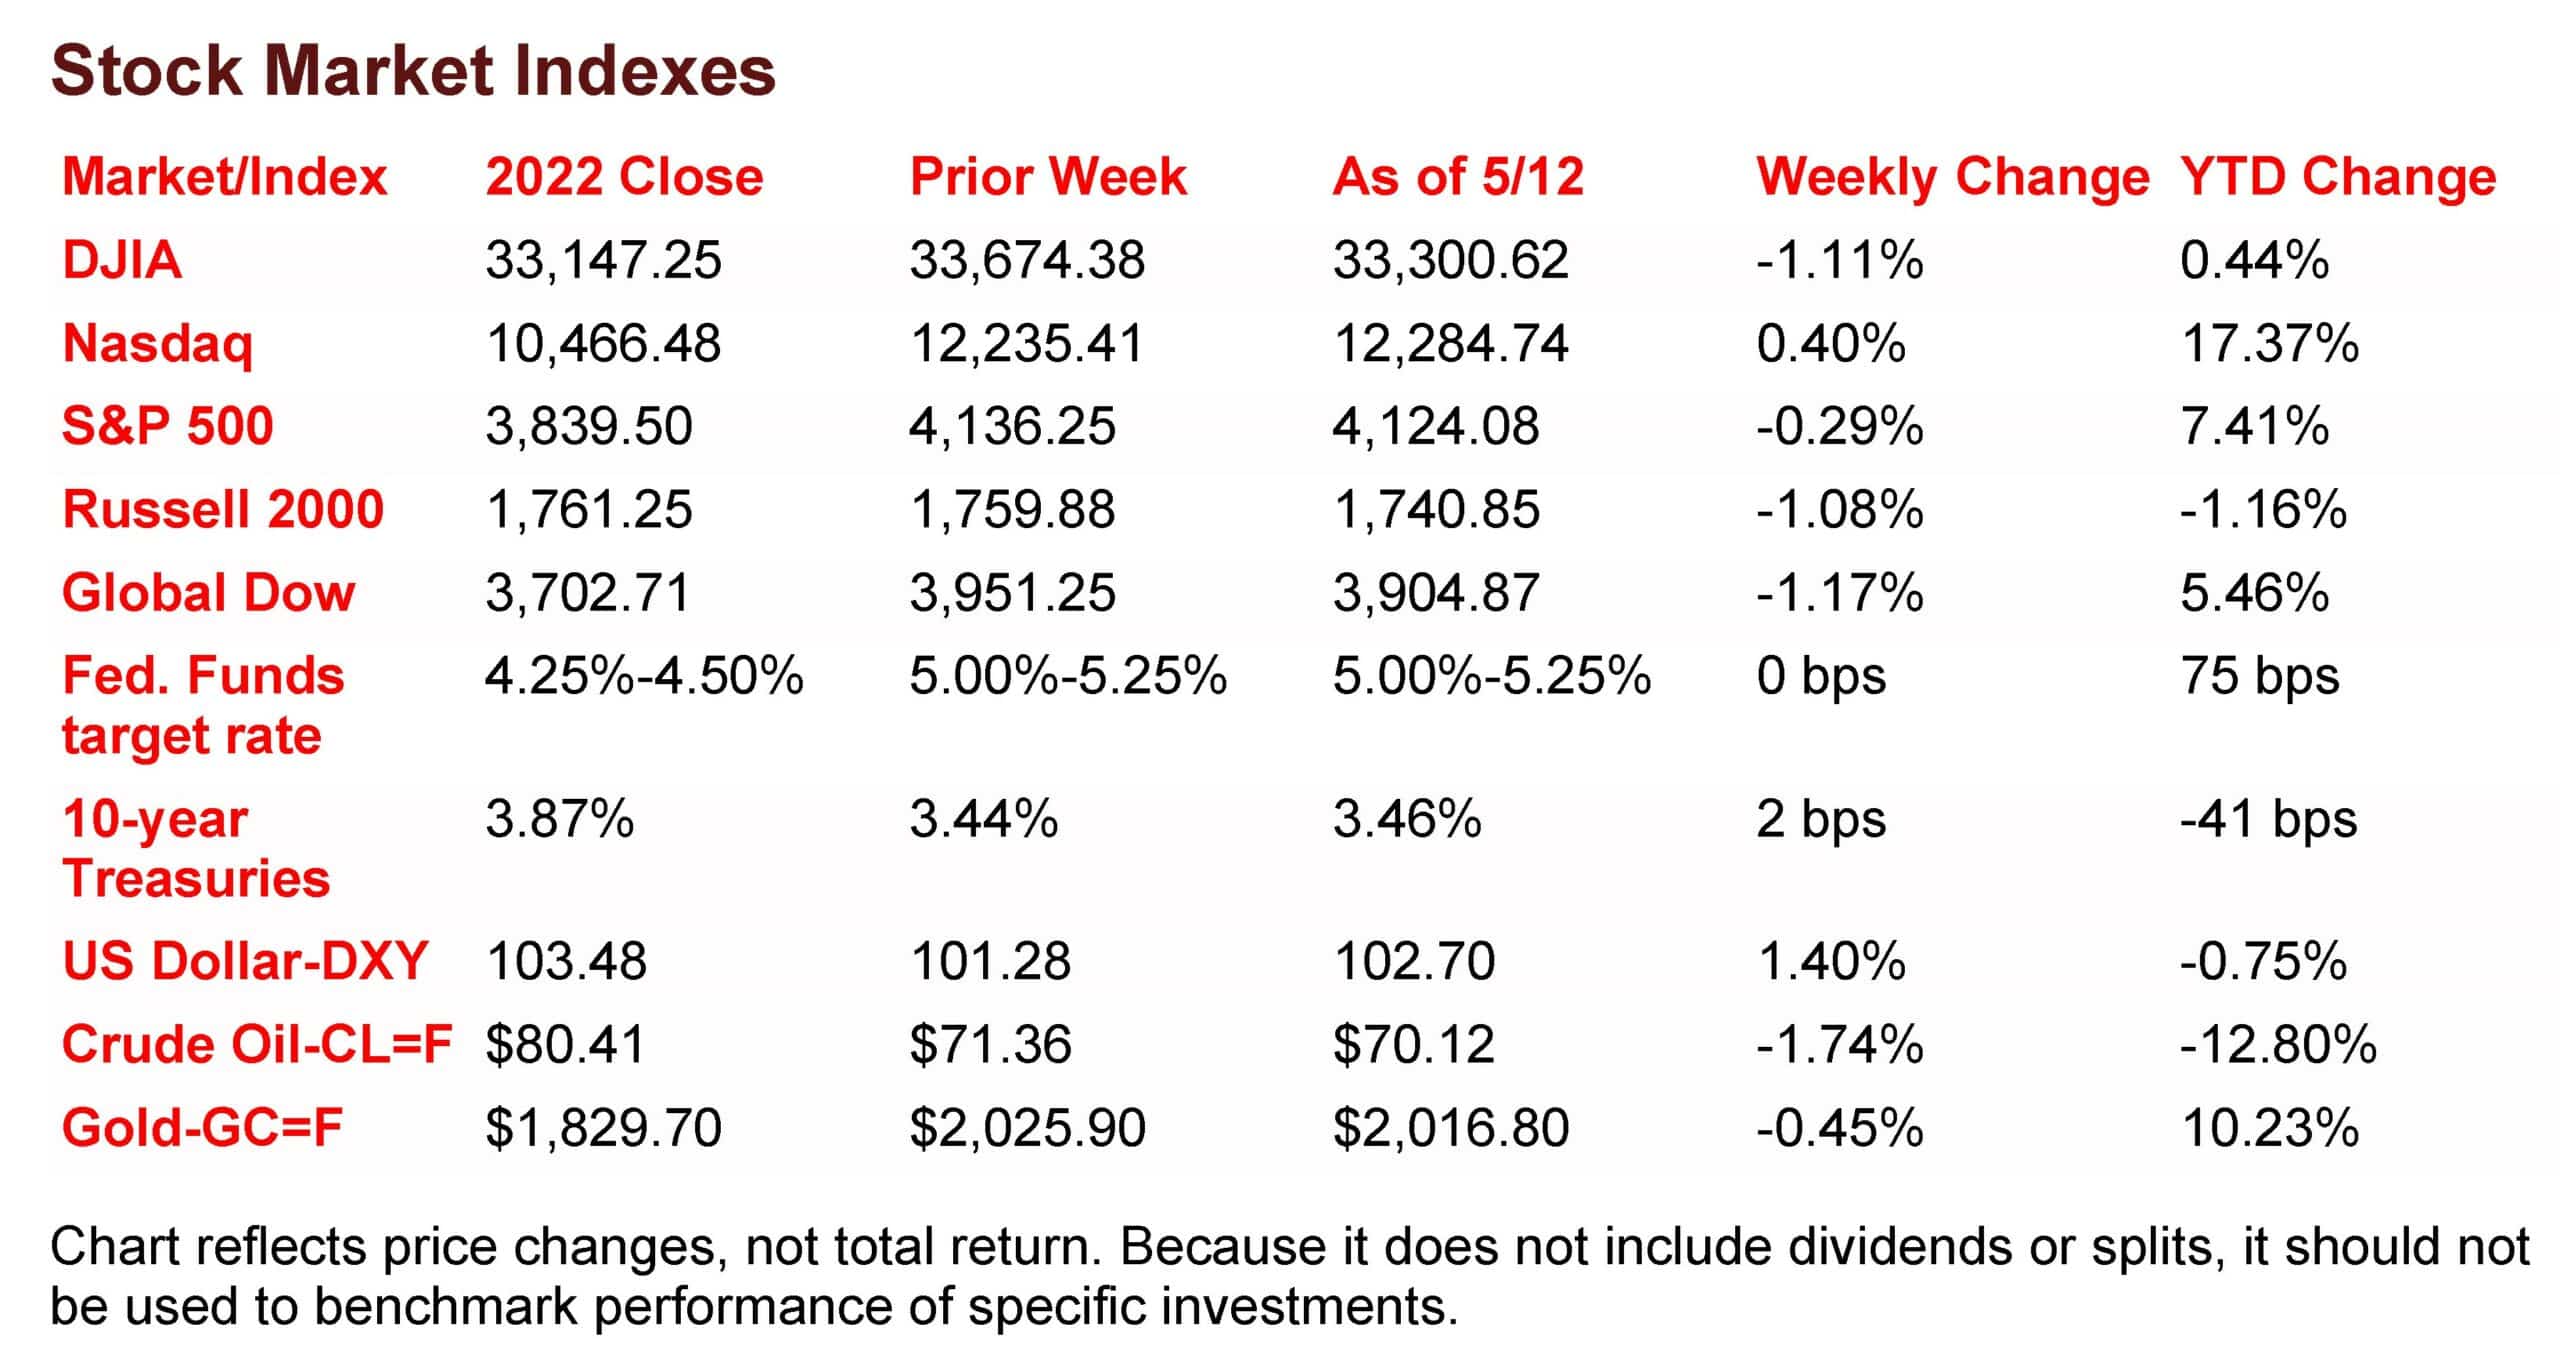
The Markets (as of market close May 12, 2023)
Stocks trended lower last week, with only the Nasdaq able to eke out a gain. Investors remained pensive as they await negotiations on the debt ceiling. With roughly 92% of the S&P 500 companies having reported first-quarter earnings thus far, results appear headed down 2.5% from last year. This follows a 4.6% drop in fourth-quarter earnings. Despite the downturn, FactSet reported that 78% of the companies have reported earnings that beat expectations, which is the most since the third quarter of 2021. So far in 2023, only the Russell 2000 has yet to reach its 2022 closing value. The remaining benchmark indexes listed here remain ahead of where they began this year, despite lackluster results through the first two weeks of May. Crude oil prices declined for the fourth consecutive week on concerns of weakening demand. Gold prices slipped lower but remained over $2,000.00 per ounce.
The Dow and the Russell 2000 slipped on a day of mixed returns last Monday. The Nasdaq, the S&P 500, and the Global Dow inched up minimally. In fact, the indexes moved very little throughout the day as investors contemplated ongoing banking concerns and the debt ceiling negotiations. Ten-year Treasury yields added 7.5 basis points to close at 3.52%. Crude oil prices gained 2.0% to reach $72.79 per barrel. The dollar and gold prices advanced on the day.
Last Tuesday proved to be another lackluster day of trading in the market as investors awaited the latest inflation data and the outcome of the meeting between President Biden and House Speaker McCarthy over the debt ceiling. The Nasdaq (-0.6%) and the S&P 500 (-0.5%) slid the furthest among the benchmark indexes, followed by the Global Dow and the Russell 2000, which dipped 0.3%. The Dow lost 0.2% on the day. The yield on 10-year Treasuries was flat at 3.52%. Crude oil prices continued to advance, gaining 0.5% to $73.51 per barrel. The dollar and gold prices rose higher.
Stocks rebounded last Wednesday, with the Nasdaq (1.0%), the Russell 2000 (0.6%), and the S&P 500 (0.5%) posting gains, while the Global Dow (-0.3%) and the Dow (-0.1%) dipped lower. Bond prices rose on increased demand, pulling yields lower. Ten-year Treasury yields lost 8.2 basis points to settle at 3.43%. Crude oil prices slid 1.3% to $72.79 per barrel. The dollar and gold prices also declined. Investors took some encouragement that inflation may be trending lower following the April Consumer Price Index report (see below), which showed prices increased 4.9% since April 2022, the smallest 12-month increase in two years.
The Nasdaq was the only benchmark index to close higher (0.2%) last Thursday, driven by large-cap tech stocks. The other benchmark indexes listed here ended the session lower with the small caps of the Russell 2000 falling 0.8%, followed by the Dow (-0.7%), the Global Dow (-0.6%), and the S&P 500 (-0.2%). Ten-year Treasury yields declined to 3.39%. The dollar rose higher, while gold prices fell for the second straight session.
Wall Street saw stocks falter last Friday as the Dow fell for the fifth straight session. The Nasdaq fell 0.4%, the Global Dow lost 0.3%, the Russell 2000 and the S&P 500 declined 0.2%, while the Dow slipped 0.1%. Crude oil prices fell 1.1%, the dollar advanced 0.6%, while gold prices decreased 0.2%. The yield on 10-year Treasuries added 6.6 basis points to reach 3.46%.
Last Week’s Economic News
The Consumer Price Index rose 0.4% in April after inching up 0.1% in March. Over the last 12 months, the CPI has increased 4.9%, the smallest 12-month increase since the period ended April 2021. Consumer prices less food and energy also rose 0.4% in April and 5.5% since April 2022. In April, prices increased in shelter, used cars and trucks, motor vehicle insurance, recreation, household furnishings and operations, and personal care. Airline fares and prices for new vehicles were among those that decreased over the month.
Prices producers received for goods and services rose 0.2% in April, the first monthly advance since January. Producer prices moved up 2.3% for the 12 months ended in April. Prices less foods, energy, and trade services rose 0.2% in April after inching up 0.1% in March. For the 12 months ended in April, prices less foods, energy, and trade services increased 3.4%. In April, prices for services moved up 0.3%, the largest increase since a 0.4% rise in November 2022. Prices for goods increased 0.2% in April after falling 1.0% in March. An 8.4% advance in prices for gasoline was a major factor in the April increase in prices for goods.
Import prices increased for the first time in 2023 after advancing 0.4% in April. Export prices rose 0.2% last month after declining 0.6% the previous month. Since April 2022, import prices have fallen 4.8%, while export prices are down 5.9%. Import fuel prices rose 4.5% in April following a 3.9% drop in March. The April advance was the first monthly increase in import fuel prices since June 2022. Despite the monthly rise, import fuel prices fell 25.9% over the past year. Import prices for foods, feeds, and beverages advanced 0.2% in April following a 0.9% decline in March. Higher prices for fruit and meat in April more than offset lower prices for vegetables. Higher prices for agricultural exports (0.4%) and nonagricultural exports (0.2%) drove the overall increase in export prices in April.
The monthly federal Treasury statement showed the government enjoyed a surplus of $176.2 billion in April. Total receipts were $638.5 billion, while government expenditures were $462.3 billion. Through seven months of fiscal year 2023, the government deficit sits at $924.5 billion, $564.5 billion above the deficit over the same period in fiscal year 2022.
The national average retail price for regular gasoline was $3.533 per gallon on May 8, $0.067 per gallon less than the prior week’s price and $0.795 less than a year ago. Also, as of May 8, the East Coast price decreased $0.065 to $3.427 per gallon; the Gulf Coast price fell $0.108 to $3.045 per gallon; the Midwest price declined $0.091 to $3.393 per gallon; the Rocky Mountain price rose $0.004 to $3.538 per gallon; and the West Coast price dipped $0.017 to $4.530 per gallon.
For the week ended May 6, there were 264,000 new claims for unemployment insurance, an increase of 22,000 from the previous week’s level. According to the Department of Labor, the advance rate for insured unemployment claims for the week ended April 29 was 1.2%, unchanged from the previous week’s rate. The advance number of those receiving unemployment insurance benefits during the week ended April 29 was 1,813,000, an increase of 12,000 from the previous week’s level, which was revised down by 4,000. States and territories with the highest insured unemployment rates for the week ended April 22 were California (2.4%), New Jersey (2.2%), Massachusetts (2.0%), Alaska (1.7%), Minnesota (1.7%), New York (1.6%), Oregon (1.6%), Puerto Rico (1.6%), Rhode Island (1.6%), Illinois (1.5%), and
Washington (1.5%). The largest increases in initial claims for unemployment insurance for the week
ended April 29 were in Massachusetts (+3,801), Kentucky (+3,659), Pennsylvania (+992), Virginia
(+896), and Colorado (+726), while the largest decreases were in New York (-9,456), Illinois (-2,693),
Georgia (-1,278), New Jersey (-783), and Ohio (-505).
Eye on the Week Ahead
Following the latest report on retail sales released early this week, the focus shifts to the housing sector. The April data on housing permits, starts, and completions is available this week. In March, the number of building permits issued, housing starts, and housing completions slid lower from the previous month. Existing home sales fell 2.4% in March but look to bounce back in April as inventory of homes available for sale increased and mortgage rates have stabilized somewhat.
Key Dates/Data Releases
- 5/16: Retail sales, industrial production
- 5/17: Housing starts
- 5/18: Existing home sales
Scarlet Oak Financial Services can be reached at 800.871.1219 or contact us here. Click here to sign up for our weekly newsletter with the latest economic news.
Data sources:
Economic: Based on data from U.S. Bureau of Labor Statistics (unemployment, inflation);
U.S. Department of Commerce (GDP, corporate profits, retail sales, housing); S&P/Case-Shiller 20-City Composite Index (home prices); Institute for Supply Management (manufacturing/services). Performance: Based on data reported in WSJ Market Data Center (indexes); U.S. Treasury (Treasury yields); U.S. Energy Information Administration/Bloomberg.com Market Data (oil spot price, WTI, Cushing, OK); www.goldprice.org (spot gold/silver); Oanda/FX Street (currency exchange rates). News items are based on reports from multiple commonly available international news sources (i.e., wire services) and are independently verified when necessary with secondary sources such as government agencies, corporate press releases, or trade organizations. All information is based on sources deemed reliable, but no warranty or guarantee is made as to its accuracy or completeness. Neither the information nor any opinion expressed herein constitutes a solicitation for the purchase or sale of any securities, and should not be relied on as financial advice. Forecasts are based on current conditions, subject to change, and may not come to pass. U.S. Treasury securities are guaranteed by the federal government as to the timely payment of principal and interest. The principal value of Treasury securities and other bonds fluctuates with market conditions. Bonds are subject to inflation, interest-rate, and credit risks. As interest rates rise, bond prices typically fall. A bond sold or redeemed prior to maturity may be subject to loss. Past performance is no guarantee of future results. All investing involves risk, including the potential loss of principal, and there can be no guarantee that any investing strategy will be successful.
The Dow Jones Industrial Average (DJIA) is a price-weighted index composed of 30 widely traded blue-chip U.S. common stocks. The S&P 500 is a market-cap weighted index composed of the common stocks of 500 largest, publicly traded companies in leading industries of the U.S. economy. The NASDAQ Composite Index is a market-value weighted index of all common stocks listed on the NASDAQ stock exchange. The Russell 2000 is a market-cap weighted index composed of 2,000 U.S. small-cap common stocks. The Global Dow is an equally weighted index of 150 widely traded blue-chip common stocks worldwide. The U.S. Dollar Index is a geometrically weighted index of the value of the U.S. dollar relative to six foreign currencies. Market indexes listed are unmanaged and are not available for direct investment.
Broadridge Investor Communication Solutions, Inc. prepared this material for use by Scarlet Oak Financial Services.
Broadridge Investor Communication Solutions, Inc. does not provide investment, tax, legal, or retirement advice or recommendations. The information presented here is not specific to any individual’s personal circumstances. To the extent that this material concerns tax matters, it is not intended or written to be used, and cannot be used, by a taxpayer for the purpose of avoiding penalties that may be imposed by law. Each taxpayer should seek independent advice from a tax professional based on individual circumstances. Scarlet Oak Financial Services provide these materials for general information and educational purposes based upon publicly available information from sources believed to be reliable — we cannot assure the accuracy or completeness of these materials. The information in these materials may change at any time and without notice.
