
Market Week: May 30, 2023
Last Week’s Recap:
Throughout the week, stocks fluctuate due to potential US debt default concerns. However, artificial intelligence (AI) stocks surged Thursday, boosting the Nasdaq and S&P 500. Last Friday, stocks closed higher as traders grew more confident that a deal on the US debt ceiling would be reached.
Additionally, the first-quarter GDP’s second estimate was upgraded by 0.2 percentage point to 1.3%, and personal consumption expenditures rose by 3.8%. However, inflationary pressure surged in April, with the personal consumption expenditures price index rising by 0.4%. The international trade in goods deficit expanded beyond expectations in April, increasing by 17.0% from March. On a positive note, April marked the second consecutive month of durable goods new orders growth, and sales of new single-family homes also increased for the second consecutive month.
The Markets (as of market close May 26, 2023)
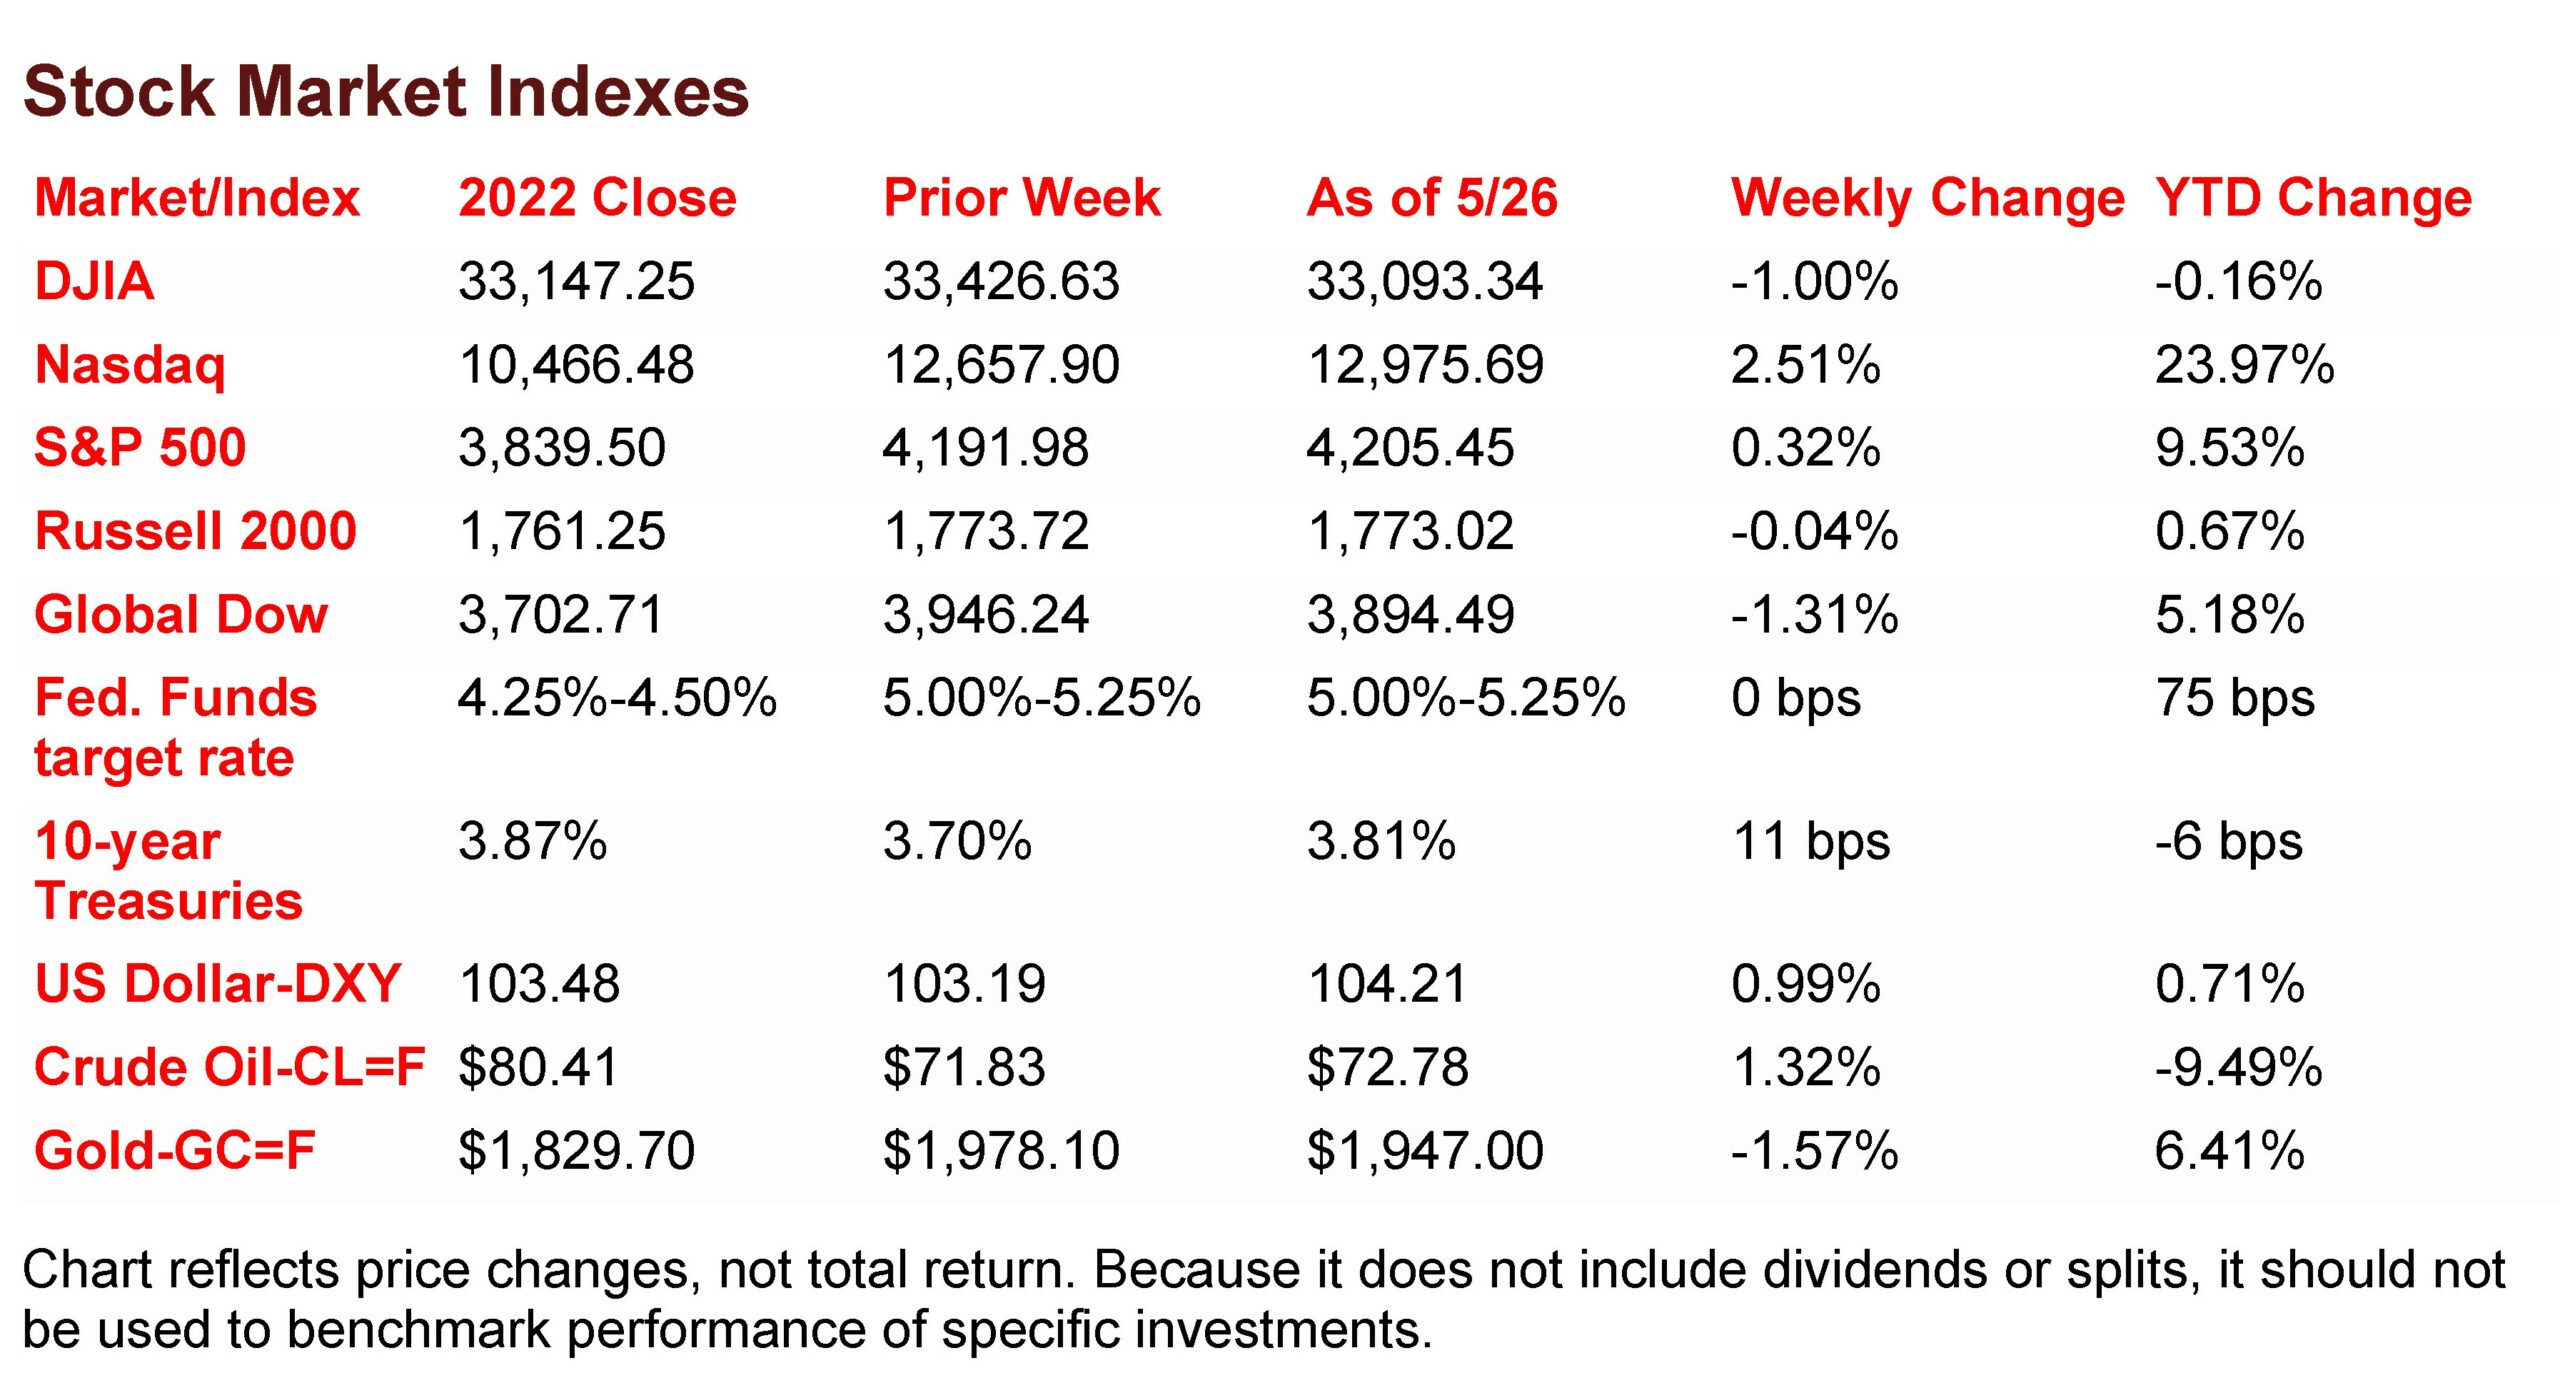
Wall Street ended last week with mixed returns. The Nasdaq and the S&P 500 were pushed higher by tech shares and artificial intelligence (AI) stocks. The Global Dow, the Dow, and the Russell 2000 closed in the red. Ten-year Treasury yields rose 11.0 basis points, as they drew closer to their 2022 year-end values. For much of last week, investors kept a close watch on negotiations involving the U.S. debt ceiling. By last Friday, it appeared progress was being made on a deal to raise the debt limit and cap federal spending for two years. Crude oil prices advanced for the second straight week. The dollar advanced against a basket of currencies, while gold prices declined for the third consecutive week.
Stocks closed last Monday generally higher, driven by advances in technology, communications, small-cap stocks, and financials. Investors focused on late-afternoon debt ceiling talks between President Biden and House Speaker McCarthy. The Russell 2000 gained 1.2% to lead the benchmark indexes listed here, followed by the Nasdaq, which climbed 0.5%. The S&P 500 and the Global Dow ended the day flat, while the Dow dipped 0.4%. Ten-year Treasury yields inched up 2.7 basis points to 3.71%. Crude oil prices gained 0.4% to $71.81 per barrel. The dollar edged higher, while gold prices fell 0.4%.
Debt ceiling worries hit Wall Street last Tuesday, sending stocks lower. The Nasdaq fell 1.3%, followed by the S&P 500 (-1.1%), the Global Dow and the Dow (-0.7%), with the Russell 2000 dipping 0.3%. Ten-year Treasury yields slipped 2.1 basis points to 3.69%. Crude oil prices advanced for the second consecutive day, climbing 1.4% to $73.06 per barrel. The dollar and gold prices increased.
Last Wednesday saw stocks slide lower for a second straight session. Once again, investors worried about a potential U.S. debt default. The Russell 2000 and the Global Dow dropped 1.2%, the Dow fell 0.8%, the S&P 500 lost 0.7%, and the Nasdaq slipped 0.6%. Ten-year Treasury yields inched higher to close at 3.71%. Crude oil prices continued to climb, jumping 1.3% to $73.86 per barrel. The dollar advanced, while gold prices fell 0.6%.
AI stocks surged last Thursday, pushing the Nasdaq and the S&P 500 higher among the benchmark indexes listed here. Communication services and information technology posted notable gains, which, along with consumer discretionary, were the only market sectors to close higher. The Nasdaq gained 1.7% and the S&P 500 rose 0.9%. The Russell 2000 fell 0.7%, the Global Dow dropped 0.3%, and the Dow slipped 0.1%. Yields on 10-year Treasuries added 9.5 basis points to close at 3.81%. The dollar advanced for the fourth straight session. Gold prices dipped 1.2%. Crude oil prices reversed course, slumping 3.3% to $71.92 per barrel.
Stocks closed higher last Friday, as traders grew more confident that a deal on the U.S. debt ceiling would be reached. For the second straight day, tech and AI stocks drove the indexes. The Nasdaq gained 2.2%, the S&P 500 rose 1.3%, the Russell 2000 climbed 1.1%, the Dow added 1.0%, and the Global Dow advanced 0.8%. Ten-year Treasury yields were flat, closing at 3.81%. Crude oil prices advanced 1.3% to $72.78 per barrel. The dollar dipped lower, while gold prices inched higher.
 Last Week’s Economic News
The second estimate for the first-quarter gross domestic product was revised up 0.2 percentage point to 1.3%. GDP expanded at an annualized rate of 2.6% in the fourth quarter. Personal consumption expenditures increased 3.8%. Consumer spending on durable goods rose 6.3%, while spending on services increased 2.5%. Residential fixed investment dropped 5.4%, while nonresidential fixed investment increased 1.4%. Exports advanced 5.2%, while imports, which are a negative in the calculation of GDP, increased 4.0%. The personal consumption expenditures price index increased 4.2%.
Inflationary pressures increased in April, giving more reason for the Federal Reserve to continue to increase interest rates. The personal consumption expenditures price index rose 0.4% in April after inching up 0.1% in March. Consumer prices less food and energy also rose 0.4% in April. Over the last 12 months, consumer prices have increased 4.4%, well above the Fed target rate of 2.0%. Personal income and disposable personal income rose 0.4% in April. Consumer spending jumped 0.8% in April after increasing 0.1% in March.
The international trade in goods deficit widened more than expected in April, up 17.0% from March. Exports decreased 5.5%, while imports rose 1.8%. Since April of 2022, exports of goods have declined 5.8%, while imports are down 7.1%.
New orders for durable goods increased for the second straight month in April, after increasing 1.1% from March. Transportation equipment, also up for two consecutive months, drove the increase, up 3.7% in April.
Sales of new single-family homes increased for the second straight month in April, climbing 4.1% over the March total. Available inventory in April declined to a supply of 7.6 months, down from the March pace of 7.9 months. The median single-family home price in April was $420,800, a decline of 8.3% from March ($455,800) and 8.9% below the April 2022 median sales price of $458,200. The average sales price in April was $501,000, 11.6% under the March price of $559,200 and 12.2% below the April 2022 average sales price of $562,400.
The national average retail price for regular gasoline was $3.534 per gallon on May 22, $0.002 per gallon lower than the prior week’s price and $1.059 less than a year ago. Also, as of May 22, the East Coast price decreased $0.016 to $3.381 per gallon; the Gulf Coast price fell $0.039 to $3.040 per gallon; the Midwest price increased $0.029 to $3.469 per gallon; the Rocky Mountain price rose $0.061 to $3.579 per gallon; and the West Coast price dipped $0.005 to $4.514 per gallon.
For the week ended May 20, there were 229,000 new claims for unemployment insurance, an increase of 4,000 from the previous week’s level, which was revised down by 17,000. According to the Department of Labor, the advance rate for insured unemployment claims for the week ended May 13 was 1.2%, unchanged from the previous week’s rate. The advance number of those receiving unemployment insurance benefits during the week ended May 13 was 1,794,000, a decrease of 5,000 from the previous week’s level. States and territories with the highest insured unemployment rates for the week ended May 6 were California (2.3%), New Jersey (2.2%), Massachusetts (2.0%), Alaska (1.6%), New York (1.6%), Oregon (1.6%), Puerto Rico (1.5%), Rhode Island (1.5%), Washington (1.5%), and Illinois (1.4%). The largest increases in initial claims for unemployment insurance for the week ended May 13 were in Ohio (+1,608), Connecticut (+975), Illinois (+868), Tennessee (+640), and Colorado (+599), while the largest decreases were in Missouri (-2,234), Massachusetts (-1,660), New Jersey (-1,016), Pennsylvania (-742), and Virginia (-715).
Eye on the Week Ahead
The labor sector is front and center this week with the releases of the April Job Openings and Labor Turnover Survey (JOLTS) and the May report on employment. In March, the number of job openings decreased 384,000, while the number of hires and separations changed little. The employment situation report showed 253,000 jobs were added in April, while the number of unemployed was relatively unchanged.
Key Dates/Data Releases
- 5/31: JOLTS
- 6/1: S&P Manufacturing PMI
- 6/2: Employment situation
Scarlet Oak Financial Services can be reached at 800.871.1219 or contact us here. Click here to sign up for our weekly newsletter with the latest economic news.
Data sources:
Economic: Based on data from U.S. Bureau of Labor Statistics (unemployment, inflation);
U.S. Department of Commerce (GDP, corporate profits, retail sales, housing); S&P/Case-Shiller 20-City Composite Index (home prices); Institute for Supply Management (manufacturing/services). Performance: Based on data reported in WSJ Market Data Center (indexes); U.S. Treasury (Treasury yields); U.S. Energy Information Administration/Bloomberg.com Market Data (oil spot price, WTI, Cushing, OK); www.goldprice.org (spot gold/silver); Oanda/FX Street (currency exchange rates). News items are based on reports from multiple commonly available international news sources (i.e., wire services) and are independently verified when necessary with secondary sources such as government agencies, corporate press releases, or trade organizations. All information is based on sources deemed reliable, but no warranty or guarantee is made as to its accuracy or completeness. Neither the information nor any opinion expressed herein constitutes a solicitation for the purchase or sale of any securities, and should not be relied on as financial advice. Forecasts are based on current conditions, subject to change, and may not come to pass. U.S. Treasury securities are guaranteed by the federal government as to the timely payment of principal and interest. The principal value of Treasury securities and other bonds fluctuates with market conditions. Bonds are subject to inflation, interest-rate, and credit risks. As interest rates rise, bond prices typically fall. A bond sold or redeemed prior to maturity may be subject to loss. Past performance is no guarantee of future results. All investing involves risk, including the potential loss of principal, and there can be no guarantee that any investing strategy will be successful.
The Dow Jones Industrial Average (DJIA) is a price-weighted index composed of 30 widely traded blue-chip U.S. common stocks. The S&P 500 is a market-cap weighted index composed of the common stocks of 500 largest, publicly traded companies in leading industries of the U.S. economy. The NASDAQ Composite Index is a market-value weighted index of all common stocks listed on the NASDAQ stock exchange. The Russell 2000 is a market-cap weighted index composed of 2,000 U.S. small-cap common stocks. The Global Dow is an equally weighted index of 150 widely traded blue-chip common stocks worldwide. The U.S. Dollar Index is a geometrically weighted index of the value of the U.S. dollar relative to six foreign currencies. Market indexes listed are unmanaged and are not available for direct investment.
Broadridge Investor Communication Solutions, Inc. prepared this material for use by Scarlet Oak Financial Services.
Broadridge Investor Communication Solutions, Inc. does not provide investment, tax, legal, or retirement advice or recommendations. The information presented here is not specific to any individual’s personal circumstances. To the extent that this material concerns tax matters, it is not intended or written to be used, and cannot be used, by a taxpayer for the purpose of avoiding penalties that may be imposed by law. Each taxpayer should seek independent advice from a tax professional based on individual circumstances. Scarlet Oak Financial Services provide these materials for general information and educational purposes based upon publicly available information from sources believed to be reliable — we cannot assure the accuracy or completeness of these materials. The information in these materials may change at any time and without notice.
