
As we navigate the complexities of global markets and economic trends, we want to present an annual market review for 2023 and also reflect on how last year’s trends might affect 2024. Download the LPL Financial Research Outlook 2024 below. LPL Financial’s report aims to provide valuable insights and analysis to help you make informed decisions in the ever-changing financial world. Empower yourself with the knowledge needed to navigate the financial turning points ahead. *
Overview 2023
The year 2023 was dominated by inflation and the Federal Reserve’s restrictive policy in response to it. The year began with inflation at about 6.5%, with the Fed raising interest rates despite fears of rising unemployment and an economic recession. But while the focus remained on inflation, several other events occurred during the year, including the a political battle over the debt ceiling and a potential government shutdown; the collapse of several banks; labor strikes; and unrest in the Middle East.
In March 2022, the Federal Reserve began to aggressively raise interest rates as part of a restrictive policy aimed at reining in escalating inflation. In 2023, there were signs that the Fed’s monetary policy was paying off. Price growth slowed, apparently without triggering a recession.
The personal consumption expenditures price index was 5.4% in January, while core prices, excluding food and energy, were 4.7%. Other than a moderate surge during the summer, the PCE price index trended lower, with the last reading at 2.6% (core prices were 3.2%) for the 12 months ended in November.
While inflation has turned lower, it remained above the Fed’s 2.0% target. However, the progress in moderating price pressures allowed the Fed to refrain from further interest rate hikes since July. In addition, recent Fed projections indicate rate cuts of 75.0 basis points in 2024, possibly in the form of three 25.0-basis point rate reductions, although changes in the economy or inflation could prompt the Fed to alter its course of action moving forward.
Raising interest rates may have helped drive down inflation, but it also had the unfortunate effect of cooling the housing market. Rising interest rates also carried over to mortgage rates, which vaulted higher, peaking at about 8.0% in October, more than double the mortgage rate during the pandemic and well above pre-pandemic levels. Higher mortgage rates translated to fewer buyers. However, home prices climbed higher year over year, primarily due to diminishing inventory. Fortunately, mortgage rates have fallen by more than a full point over the last few months of the year, settling at about 6.61% at the end of December.
In a span of a few weeks in March, three small-to-mid size U.S. banks failed, which prompted investors to lose confidence in the banking industry and sent bank stocks plummeting amid fears that more bank failures could follow. Losses on cryptocurrency investments, falling real estate investments, downturns in bond portfolios, and a run on bank deposits triggered the banking collapse. A potential escalation was likely averted by the Federal Reserve, which provided emergency loans to distressed banks, while ensuring that all deposits would be honored.
As if interest rate hikes and bank failures weren’t enough to digest, investors spent the first half of the year dissecting rhetoric over the debt ceiling crisis. In mid-January, the United States hit its debt ceiling, which prompted a political back-and-forth until the beginning of June, when an agreement was reached. The result was new legislation, the Fiscal Responsibility Act of 2023, which effectively raised the debt ceiling but capped federal government spending.
The U.S. economy proved to be resilient in 2023. Gross domestic product expanded during each of the first three quarters of the year, increasing 2.2% in the first quarter, 2.1% in the second quarter, and 4.9% in the third quarter. Consumer spending, the linchpin of the economy, also showed strength, climbing 3.1% in the third quarter. Consumers spent on both goods and services throughout the year.
The employment sector, expected by some to slow with rising interest rates, maintained strength throughout the year. While the number of new jobs trended lower during the second half of the year, job growth averaged 240,000 through November. There were 6.3 million unemployed in November 2023, compared to 6.0 million a year earlier. The unemployment rate was 3.7% and remained within a range of 3.5%-3.8% for most of the year. Average hourly earnings increased by 4.0% in 2023. The number of job openings decreased during the year but remained solid at 8.7 million.
One of the primary factors in the drop in overall inflation was a decline in energy prices. According to the Consumer Price Index, energy prices fell 5.4% over the 12 months ended in November (latest CPI data available). Gasoline prices dropped 8.9% over the same period. Food prices, on the other hand, rose 2.9%, while prices for shelter increased 6.5%.
Total industrial production declined 0.4% through November (latest data available). Manufacturing, which accounts for about 78.0% of total production, decreased 0.8%. A lengthy strike by U.S. auto workers impacted motor vehicle production in particular, and overall manufacturing in general. However, in addition to the impact of striking workers, manufacturers faced higher borrowing costs and weaker demand for goods.
As 2023 drew to a close, there were some positives to consider upon entering the new year. The GDP expanded at a greater-than-expected pace in the third quarter, and crude oil and gas prices reversed course and dipped lower. Primary inflationary indicators, such as the Consumer Price Index and the personal consumption expenditures price index, trended lower at the end of the year. If interest rates decrease, borrowing will be available to more consumers, which should help the housing sector. Stocks enjoyed a solid bounce back in 2023. If corporate earnings continue to rebound, that would bode well for stocks in 2024. There are factors that will come into play next year, but how they impact the economy and markets is open to speculation. How much longer will the Russia/Ukraine war last, and how much more financial aid will be coming from the United States? The Hamas/Israel conflict could expand to include other countries, impacting other lives and economies. And, of course, 2024 brings with it a presidential election.
Snapshot 2023
The Markets
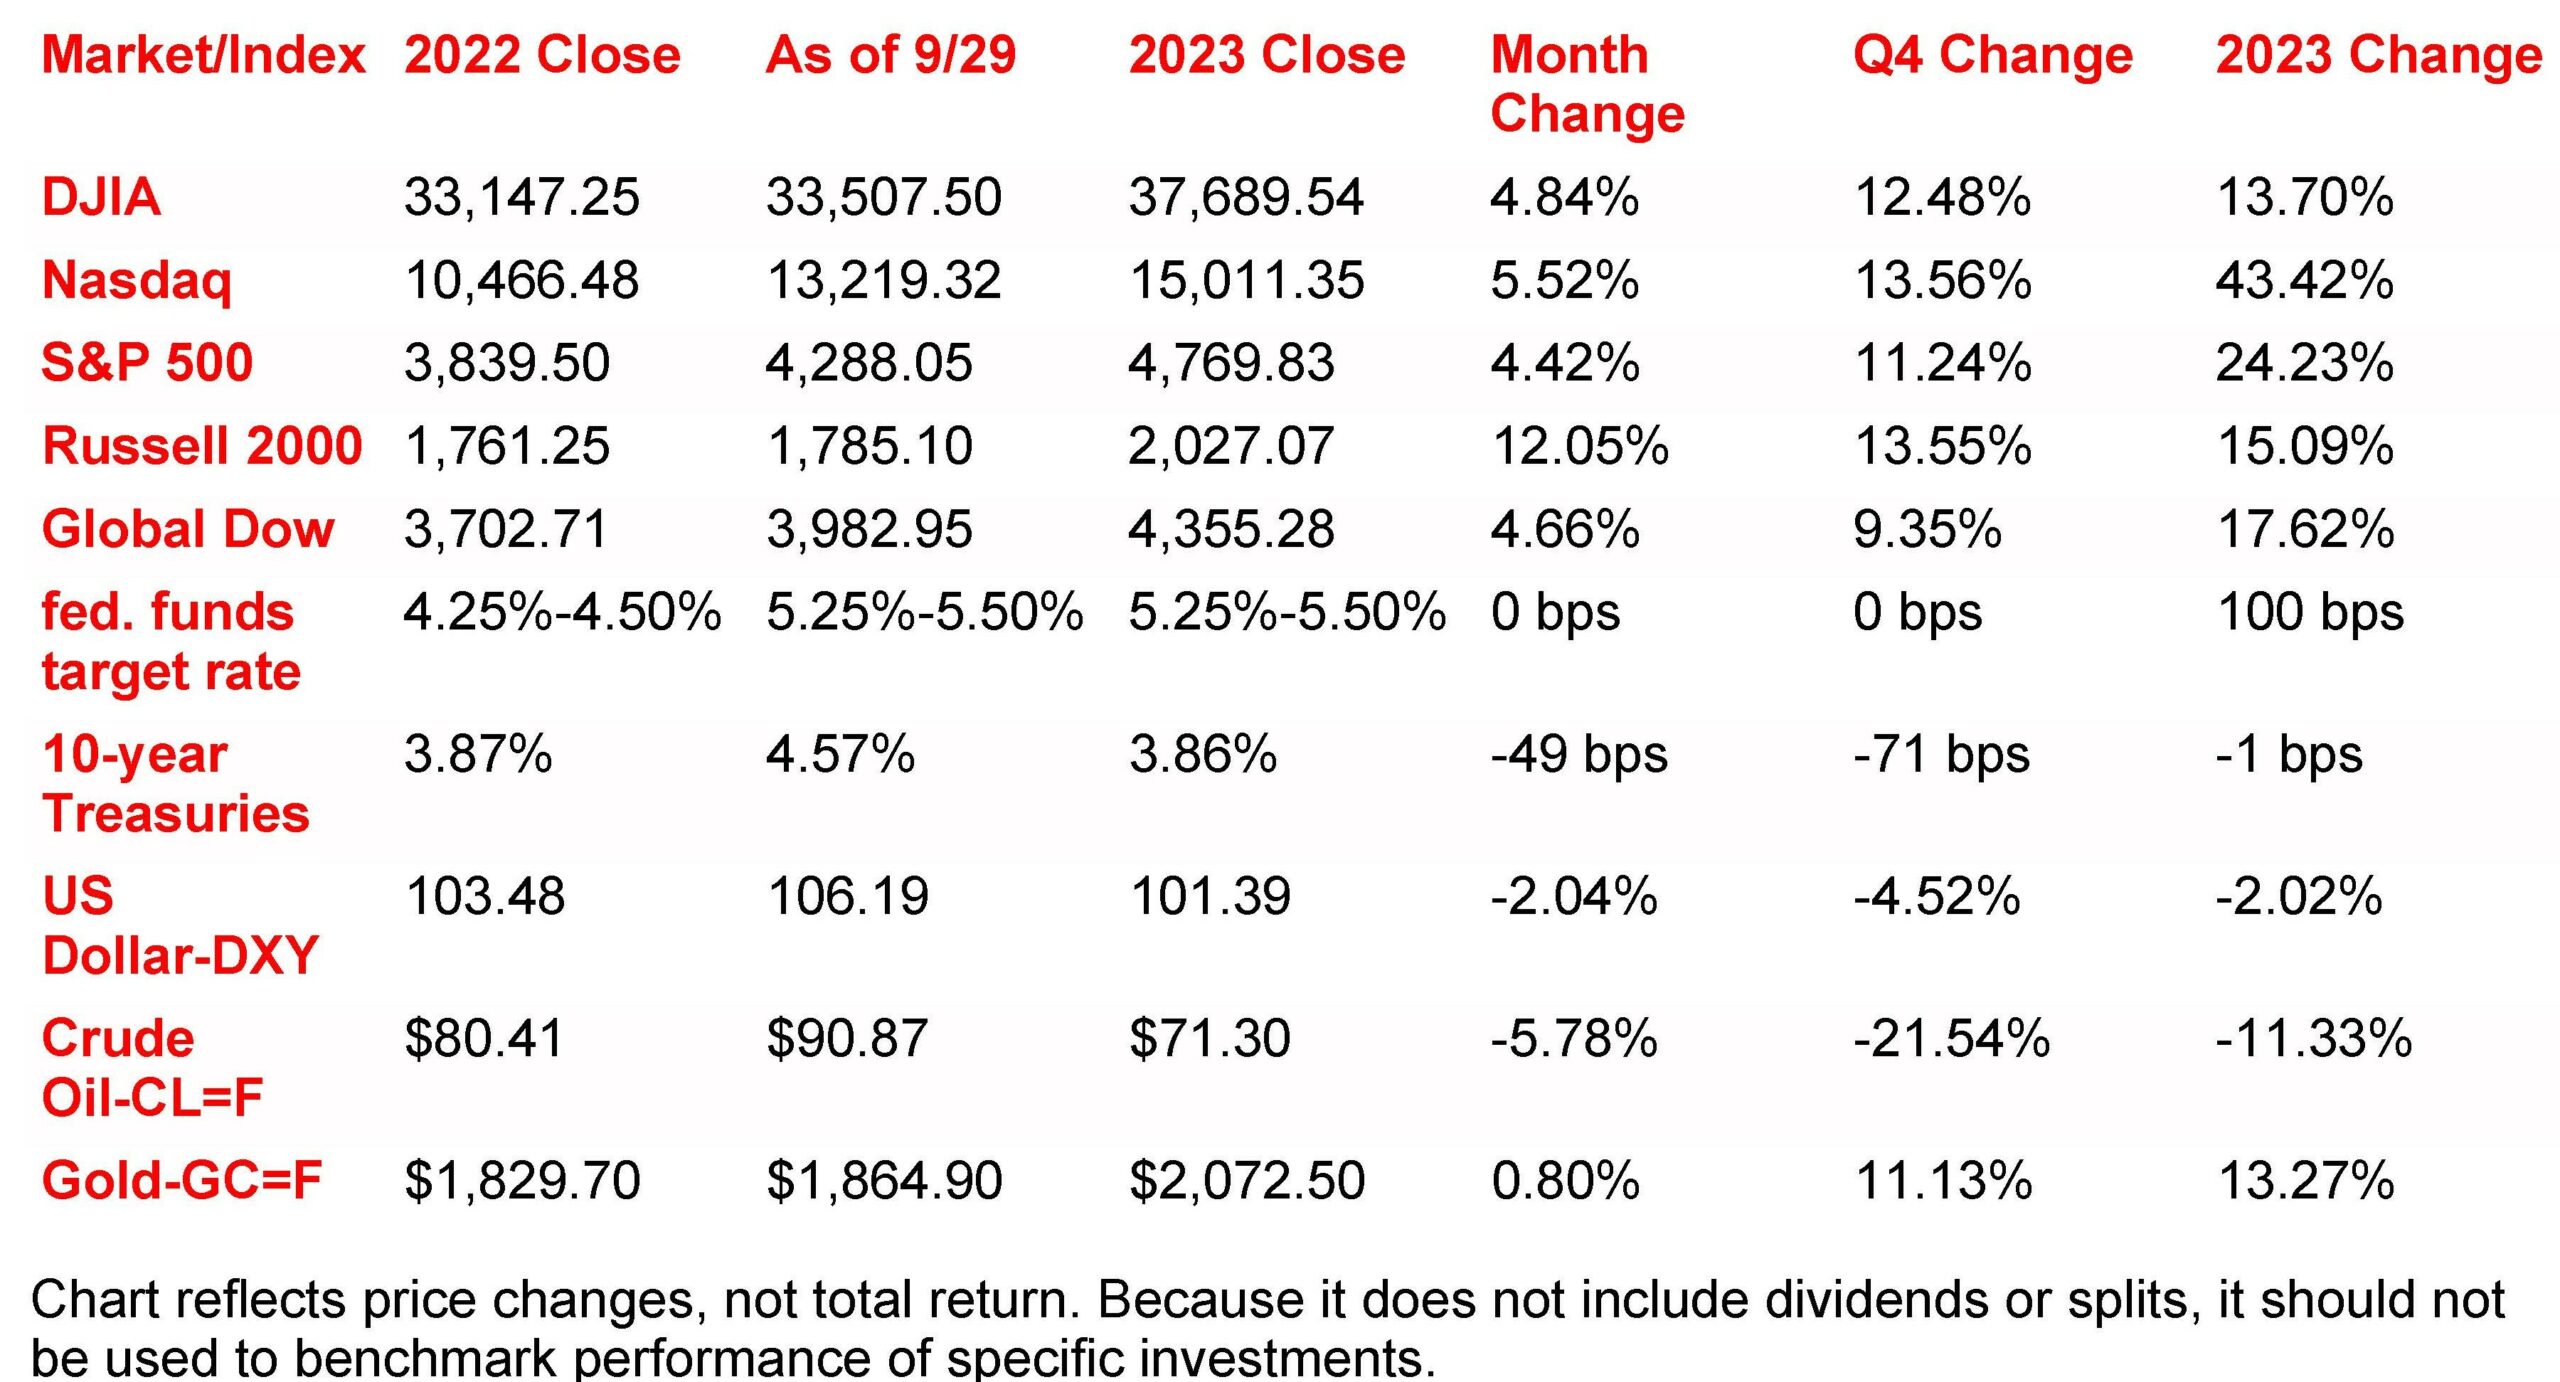
Equities: Stocks began 2023 on a positive note and ended the year trending higher. However, the ride for investors throughout the year was not always a smooth one. Traders tried to assess the impact of inflation, rising interest rates, an unexpected banking crisis, and rising global tensions. Nevertheless, the economy proved resilient, corporate profits rose, and the once anticipated economic recession never materialized. Technology stocks rebounded in 2023, with megacaps and artificial intelligence shares leading the charge. Each of the benchmark indexes listed here closed 2023 much higher compared to 2022. The Nasdaq ended the year up more than 40.0%, while the large caps of the S&P 500 gained nearly 25.0%. The Global Dow advanced about 17.0%. The small caps of the Russell 2000, under water in August, surged during the second half of the year to finish up by more than 15.0%. While the road traveled by the Dow was bumpy, that benchmark index managed to close the year up by nearly 13.0%.
In 2023, investors looked to high growth and cyclical shares, while defensive sectors lagged. Communication services and information technology gained over 55.0%. Also trending notably higher in 2023 were consumer discretionary and industrials. On the other hand, utilities, consumer staples, energy, and health care closed lower.
Bonds: For much of 2023, bond prices declined, sending yields higher. The yield on 10-year Treasuries reached a high in October at about 4.9% but steadily fell throughout the remainder of the year, ultimately settling right about where they began the year. Softening inflation data, cooling labor growth, and the expectation that interest rates will drop, helped drive bond values higher. Two-year Treasury yields also decreased from a high of 5.2% in October to 4.4% by year’s end. The Bloomberg Aggregate Bond Index, which realized the worst return in its history after declining nearly 13.0% in 2022, rose a little over 5.0% in 2023.
Oil: West Texas Intermediate (WTI) crude oil prices began the year at about $80.00 per barrel then rode a wave of volatility throughout 2023, peaking at about $93.68 in late September. Since that time, crude oil prices have steadily declined despite production cuts by OPEC+ and the Israel/Hamas conflict. Decreasing demand and booming oil production by the United States and other oil-producing countries have driven prices lower. Meanwhile, the turmoil in the Middle East did not impact production and delivery as might have been expected, although prices began to trend higher at the end of December following shipping disruptions in the Red Sea due to Houthi rebel attacks. Nevertheless, crude oil prices declined for the year, marking the first annual loss since 2020.
Prices at the pump were somewhat unpredictable throughout the year, largely responding to changes in global economics, supply and demand, and other extraordinary factors largely attributable to the unrest in the Middle East. The average retail price for a gallon of regular gasoline was $3.223 at the beginning of the year. By mid-July, the price had risen to $3.559 per gallon, capping at $3.878 per gallon in mid-September, then steadily declining for the remainder of the year to an average price of $3.116 on Christmas day.
FOMC/interest rates: The target range for the federal funds rate began the year at 4.25%-4.50% following four interest rate increases by the Federal Open Market Committee in 2022. In 2023, the FOMC announced four consecutive 25.0-basis point interest rate increases from February through July, bringing the federal funds target rate range to 5.25%-5.50%. The Committee met again in September, October, and December, however, interest rates were unchanged following each of those meetings. After its final meeting of 2023 in December, the FOMC statement indicated that the economy had slowed from its strong pace in the third quarter and that inflation, while it had eased over the past year, remained elevated. While the Committee left the door open to more rate increases if necessary to return inflation to its 2.0% target, it appeared that the current tightening cycle had peaked, and no rate hikes were foreseen. In addition, FOMC projections for 2024 would be consistent with three 25.0-basis point rate cuts, but that is speculative and could change.
US Dollar-DXY: For much of the year, the dollar rode the ebbs and flows of rising and receding inflation, both domestically and globally. After peaking in September, the dollar’s value against a basket of currencies retreated. Decreasing inflation and falling bond yields, particularly during the last two months of the year, weakened the dollar. In December, speculation grew that the Federal Reserve may begin cutting interest rates, possibly beginning in March 2024. This news further weakened the dollar, bringing its value to a five-month low by the end of the year. Overall, the dollar is set to have its worst year since 2020. In contrast, other currencies, such as the euro, have increased against the dollar. The value of the dollar is likely to further weaken in 2024, particularly if interest rates and bond yields decrease further.
Gold: Gold prices began the year at about $1,830.00 per ounce and hit a record high of $2,152.30 near the end of 2023. However, while gold prices proved less volatile in 2023, compared to 2022, there was still plenty of fluctuation in prices throughout the year. While gold prices began the year on an upswing, that quickly changed. The price of gold retreated as the economy, the dollar, and Treasury yields all saw gains, driving gold prices to a low of $1,809.87 in late February. However, the financial uncertainty caused by the bank crisis in March and April helped drive up the price of gold to over $2,000.00 per ounce. Beginning in September, particularly after the Federal Reserve announced that it would hold interest rates steady, interest in gold waned. As prices headed to below $1,800.00 per ounce, the attacks by Hamas in early October started a war with Israel, sending gold prices past the $2,000.00 per ounce mark at the end of the year.
Eye on the Year Ahead
Will waning inflation and slowing job growth prompt the Federal Reserve to lower interest rates in 2024? And if interest rates are decreased, what impact will that have on the bond and stock market? Crude oil prices and retail gas prices declined in 2023. However, the ongoing conflict in the Middle East, coupled with a cut in production, could force prices for both commodities higher this year. Lastly, 2024 is an election year, the results of which will almost certainly impact the economy in general and Wall Street in particular.
January Key Dates/Data Releases
1/2: S&P Manufacturing Index
1/3: JOLTS
1/4: S&P Services Index
1/5: Employment situation
1/9: International trade in goods and services
1/11: Consumer Price Index, Treasury budget
1/12: Producer Price Index
1/17: Retail sales, industrial production, import and export prices
1/18: Housing starts
1/19: Existing home sales
1/25: New home sales, durable goods orders, GDP, international trade in goods
1/26: Personal income and outlays
1/31: FOMC meeting statement
Scarlet Oak Financial Services can be reached at 800.871.1219 or contact us here. Click here to sign up for our newsletter with the latest economic news.
Data sources:
*Disclosure for the LPL Research Outlook 2024: A Turning Point:
Scarlet Oak Financial Services presents the LPL Research Outlook 2024: A Turning Point with the best intentions and the report is based on the latest available sources at the time of publication. However, it is crucial to note that the financial landscape is dynamic and subject to rapid changes. The content of this report is meant for educational purposes only and should not be construed as financial advice.
LPL Financial strives to offer accurate and timely information, Scarlet Oak Financial Services and LPL Financial cannot guarantee the completeness or accuracy of the content, and we expressly disclaim any liability for errors or omissions. Readers are encouraged to use their discretion and consult additional sources before making any financial decisions.
It is important to understand that the information contained in this report (LPL Research Outlook 2024: A Turning Point) is not intended as personalized financial advice. Every individual’s financial situation is unique, and decisions should be tailored to specific circumstances. For personalized advice on financial investments, taxes, or any other financial matters, it is strongly recommended to consult with a qualified financial professional.
Please be aware that the financial landscape is subject to constant evolution, and the information provided in LPL Research Outlook 2024: A Turning Point may change at any time. Scarlet Oak Financial Services and LPL Financial do not assume any obligation to update the content to reflect new information or developments. By accessing and utilizing LPL Research Outlook 2024: A Turning Point, you acknowledge and agree to the terms of this disclosure.
Data sources for the Annual Market Review 2023:
Economic: Based on data from U.S. Bureau of Labor Statistics (unemployment, inflation);
U.S. Department of Commerce (GDP, corporate profits, retail sales, housing); S&P/Case-Shiller 20-City Composite Index (home prices); Institute for Supply Management (manufacturing/services). Performance: Based on data reported in WSJ Market Data Center (indexes); U.S. Treasury (Treasury yields); U.S. Energy Information Administration/Bloomberg.com Market Data (oil spot price, WTI, Cushing, OK); www.goldprice.org (spot gold/silver); Oanda/FX Street (currency exchange rates). News items are based on reports from multiple commonly available international news sources (i.e., wire services) and are independently verified when necessary with secondary sources such as government agencies, corporate press releases, or trade organizations.
All information is based on sources deemed reliable, but no warranty or guarantee is made as to its accuracy or completeness. Neither the information nor any opinion expressed herein constitutes a solicitation for the purchase or sale of any securities, and should not be relied on as financial advice. Forecasts are based on current conditions, subject to change, and may not come to pass.
U.S. Treasury securities are guaranteed by the federal government as to the timely payment of principal and interest. The principal value of Treasury securities and other bonds fluctuates with market conditions. Bonds are subject to inflation, interest-rate, and credit risks. As interest rates rise, bond prices typically fall. A bond sold or redeemed prior to maturity may be subject to loss. Past performance is no guarantee of future results. All investing involves risk, including the potential loss of principal, and there can be no guarantee that any investing strategy will be successful.
The Dow Jones Industrial Average (DJIA) is a price-weighted index composed of 30 widely traded blue-chip U.S. common stocks. The S&P 500 is a market-cap weighted index composed of the common stocks of 500 largest, publicly traded companies in leading industries of the U.S. economy. The NASDAQ Composite Index is a market-value weighted index of all common stocks listed on the NASDAQ stock exchange. The Russell 2000 is a market-cap weighted index composed of 2,000 U.S. small-cap common stocks. The Global Dow is an equally weighted index of 150 widely traded blue-chip common stocks worldwide. The U.S. Dollar Index is a geometrically weighted index of the value of the U.S. dollar relative to six foreign currencies. Market indexes listed are unmanaged and are not available for direct investment.
Broadridge Investor Communication Solutions, Inc. prepared this material for use by Scarlet Oak Financial Services.
Broadridge Investor Communication Solutions, Inc. does not provide investment, tax, legal, or retirement advice or recommendations. The information presented here is not specific to any individual’s personal circumstances. To the extent that this material concerns tax matters, it is not intended or written to be used, and cannot be used, by a taxpayer for the purpose of avoiding penalties that may be imposed by law. Each taxpayer should seek independent advice from a tax professional based on individual circumstances. Scarlet Oak Financial Services provide these materials for general information and educational purposes based upon publicly available information from sources believed to be reliable — we cannot assure the accuracy or completeness of these materials. The information in these materials may change at any time and without notice.
