
In this year-end recap: A look back at the ascent stocks made during 2019 and some of the key economic developments of the year.
Weekly Economic Update
What Drove the Markets?
Four factors influenced investment performance in 2019: a shift in U.S. monetary policy, the ongoing trade dispute between the U.S. and China, earnings, and the economy.
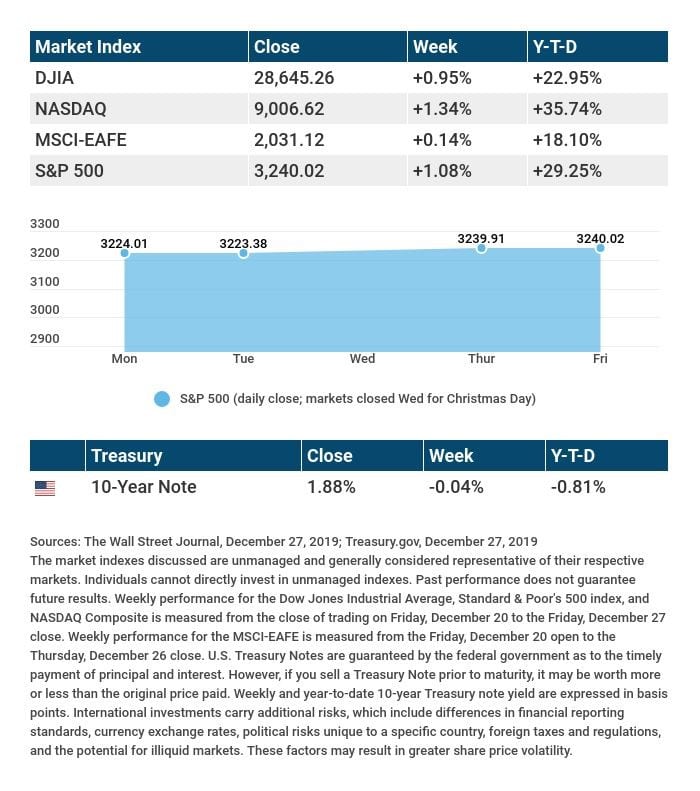
Stocks reached record highs in 2019. The S&P 500 climbed above 3,000 for the first time. The benchmark ended Friday’s trading session up 29.25% for the year. At Friday’s close, the Dow Jones Industrial Average showed a year-to-date advance of 22.95%, while the Nasdaq Composite was up 35.74% YTD. The MSCI EAFE index, representing foreign stocks, was up 18.10% YTD through December 27.1,2
The Federal Reserve Eased
The central bank made three quarter-point cuts to the benchmark short-term interest rate in 2019. That was a change from 2018, when the Fed worked on normalizing monetary policy with interest rate increases, while thinning its large bond portfolio.
By and large, investors welcomed the policy shift. At the end of 2018, there were concerns that the Fed’s effort to tighten the money supply had backfired, with higher U.S. interest rates impeding both the domestic and global economy.3
The U.S. and China Trade Quarrel Cooled Down Slightly
In December, representatives from both nations agreed on a “phase-one” trade deal after a year-and-a-half of imposing tariffs on each other’s products. This pact, which is expected to be signed in 2020, is characterized as an initial step toward a larger deal.
In May, the U.S. put 25% tariffs on $200 billion of Chinese imports; a month later, China imposed a 25% import tax on $60 billion of U.S.-made goods reaching its shores. These tariffs may be reduced or removed as part of the phase-one deal. (Another $120 billion worth of Chinese goods are currently under a 7.5% tariff, reduced from 15% by the new agreement.)4
Earnings Beat (Low) Expectations
Stock market analysts were pessimistic about corporate profits as the year began. With economies worldwide slowing down in 2018, year-over-year earnings growth for S&P 500 firms seemed poised to decelerate.
Deceleration was evident, but later in the year, many firms managed to exceed reduced estimates. According to stock market analytics firm FactSet, 75% of S&P 500 components beat earnings-per-share estimates in Q3, compared to a 5-year historical average of 72%.5
The Economy Maintained Momentum
Gross domestic product came in at 3.1% in Q1, 2.0% in Q2, and 2.1% in Q3. Through November, nonfarm payrolls growth had averaged 180,000 per month during 2019. Manufacturing output varied, as CEOs were less certain about expansion and capital investments during the first half of the year; it declined in Q1 and Q2 before improving again in Q3.6,7
The Conference Board’s Consumer Confidence Index was at 125.5 in November, above its (revised) January mark of 121.7. Inflation stayed under 2% for most of the year before reaching a 12-month high of 2.1% in November.8,9
What’s Ahead
Congress passed the Setting Every Community Up for Retirement Enhancement (SECURE) Act before Christmas, and President Trump signed it into law last week. This new law alters a key rule pertaining to traditional retirement accounts. It raises the age for Required Minimum Distributions (RMDs) from these accounts, from 70½ to 72. (If you are now 70½ or older, this change does not affect your scheduled RMDs. Only those who turn 70½ in 2020 or later are subject to the new rule.)10
THE WEEK AHEAD: KEY ECONOMIC DATA
- Tuesday: The Conference Board publishes its last monthly Consumer Confidence Index of 2019.
- Friday: The Institute for Supply Management presents its December manufacturing index, a gauge of U.S. factory activity.
Source: Econoday, December 27, 2019
The Econoday economic calendar lists upcoming U.S. economic data releases (including key economic indicators), Federal Reserve policy meetings, and speaking engagements of Federal Reserve officials. The content is developed from sources believed to be providing accurate information. The forecasts or forward-looking statements are based on assumptions and may not materialize. The forecasts also are subject to revision.
Scarlet Oak Financial Services may be reached at 800.871.1219 or contact us here.
This material was prepared by MarketingPro, Inc., and does not necessarily represent the views of the presenting party, nor their affiliates. The information herein has been derived from sources believed to be accurate. Please note – investing involves risk, and past performance is no guarantee of future results. Investments will fluctuate and when redeemed may be worth more or less than when originally invested. This information should not be construed as investment, tax or legal advice and may not be relied on for the purpose of avoiding any Federal tax penalty. This is neither a solicitation nor recommendation to purchase or sell any investment or insurance product or service, and should not be relied upon as such. All market indices discussed are unmanaged and are not illustrative of any particular investment. Indices do not incur management fees, costs and expenses, and cannot be invested into directly. All economic and performance data is historical and not indicative of future results. The Dow Jones Industrial Average is a price-weighted index of 30 actively traded blue-chip stocks. The NASDAQ Composite Index is a market-weighted index of all over-the-counter common stocks traded on the National Association of Securities Dealers Automated Quotation System. The Standard & Poor’s 500 (S&P 500) is a market-cap weighted index composed of the common stocks of 500 leading companies in leading industries of the U.S. economy. The MSCI EAFE Index is a stock market index that is designed to measure the equity market performance of developed markets outside of the U.S. and Canada. NYSE Group, Inc. (NYSE:NYX) operates two securities exchanges: the New York Stock Exchange (the “NYSE”) and NYSE Arca (formerly known as the Archipelago Exchange, or ArcaEx®, and the Pacific Exchange). NYSE Group is a leading provider of securities listing, trading and market data products and services. The New York Mercantile Exchange, Inc. (NYMEX) is the world’s largest physical commodity futures exchange and the preeminent trading forum for energy and precious metals, with trading conducted through two divisions – the NYMEX Division, home to the energy, platinum, and palladium markets, and the COMEX Division, on which all other metals trade. Additional risks are associated with international investing, such as currency fluctuations, political and economic instability and differences in accounting standards. This material represents an assessment of the market environment at a specific point in time and is not intended to be a forecast of future events, or a guarantee of future results. MarketingPro, Inc. is not affiliated with any person or firm that may be providing this information to you. The publisher is not engaged in rendering legal, accounting or other professional services. If assistance is needed, the reader is advised to engage the services of a competent professional.
CITATIONS:
1 – wsj.com/market-data [12/27/19]
2 – quotes.wsj.com/index/XX/MSCI%20GLOBAL/990300/historical-prices [12/27/19]
3 – washingtonpost.com/business/2019/12/11/year-federal-reserve-admitted-it-was-wrong/ [12/11/19]
4 – bbc.com/news/business-45899310 [12/16/19]
5 – insight.factset.com/earnings-insight-q319-by-the-numbers-infographic [11/21/19]
6 – marketwatch.com/tools/calendars/economic [12/27/19]
7 – bls.gov/iag/tgs/iag31-33.htm [12/20/19]
8 – investing.com/economic-calendar/cb-consumer-confidence-48 [12/27/19]
9 – tradingeconomics.com/united-states/inflation-cpi [12/27/19]
10 – marketwatch.com/story/with-president-trumps-signature-the-secure-act-is-passed-here-are-the-most-important-things-to-know-2019-12-21 [12/25/19]
CHART CITATIONS:
wsj.com/market-data [12/27/19]
quotes.wsj.com/index/XX/MSCI%20GLOBAL/990300/historical-prices [12/27/19]
quotes.wsj.com/index/SPX/historical-prices [12/27/19]
treasury.gov/resource-center/data-chart-center/interest-rates/Pages/TextView.aspx?data=yield [12/27/19]
treasury.gov/resource-center/data-chart-center/interest-rates/Pages/TextView.aspx?data=yieldAll [12/27/19]
