
Market Week September 18 2023
Market Recap:
Investors weighed varied economic data and the impact of the UAW strike. Tech stocks are particularly affected by rising long-term rates, which could lower the value of future profits. Crude oil prices exceeded $90 per barrel due to output cuts from Saudi Arabia and Russia and increased global consumption.
In August, the Consumer Price Index (CPI) rose by 0.6%, largely due to surging gasoline prices. The Producer Price Index (PPI) also increased by 0.7%, marking the most significant rise since June 2022. Retail and food services sales saw a 0.6% increase from the previous month. Import prices rose by 0.5%, mainly due to a 6.7% increase in fuel prices, while export prices climbed by 1.3%. Industrial production saw a modest increase of 0.4%. The federal government’s monthly deficit decreased by $89.3 billion in August. For the week ended September 9, new claims for unemployment insurance rose by 3,000 to 220,000, while the number of those receiving benefits increased by 4,000 to 1,688,000.
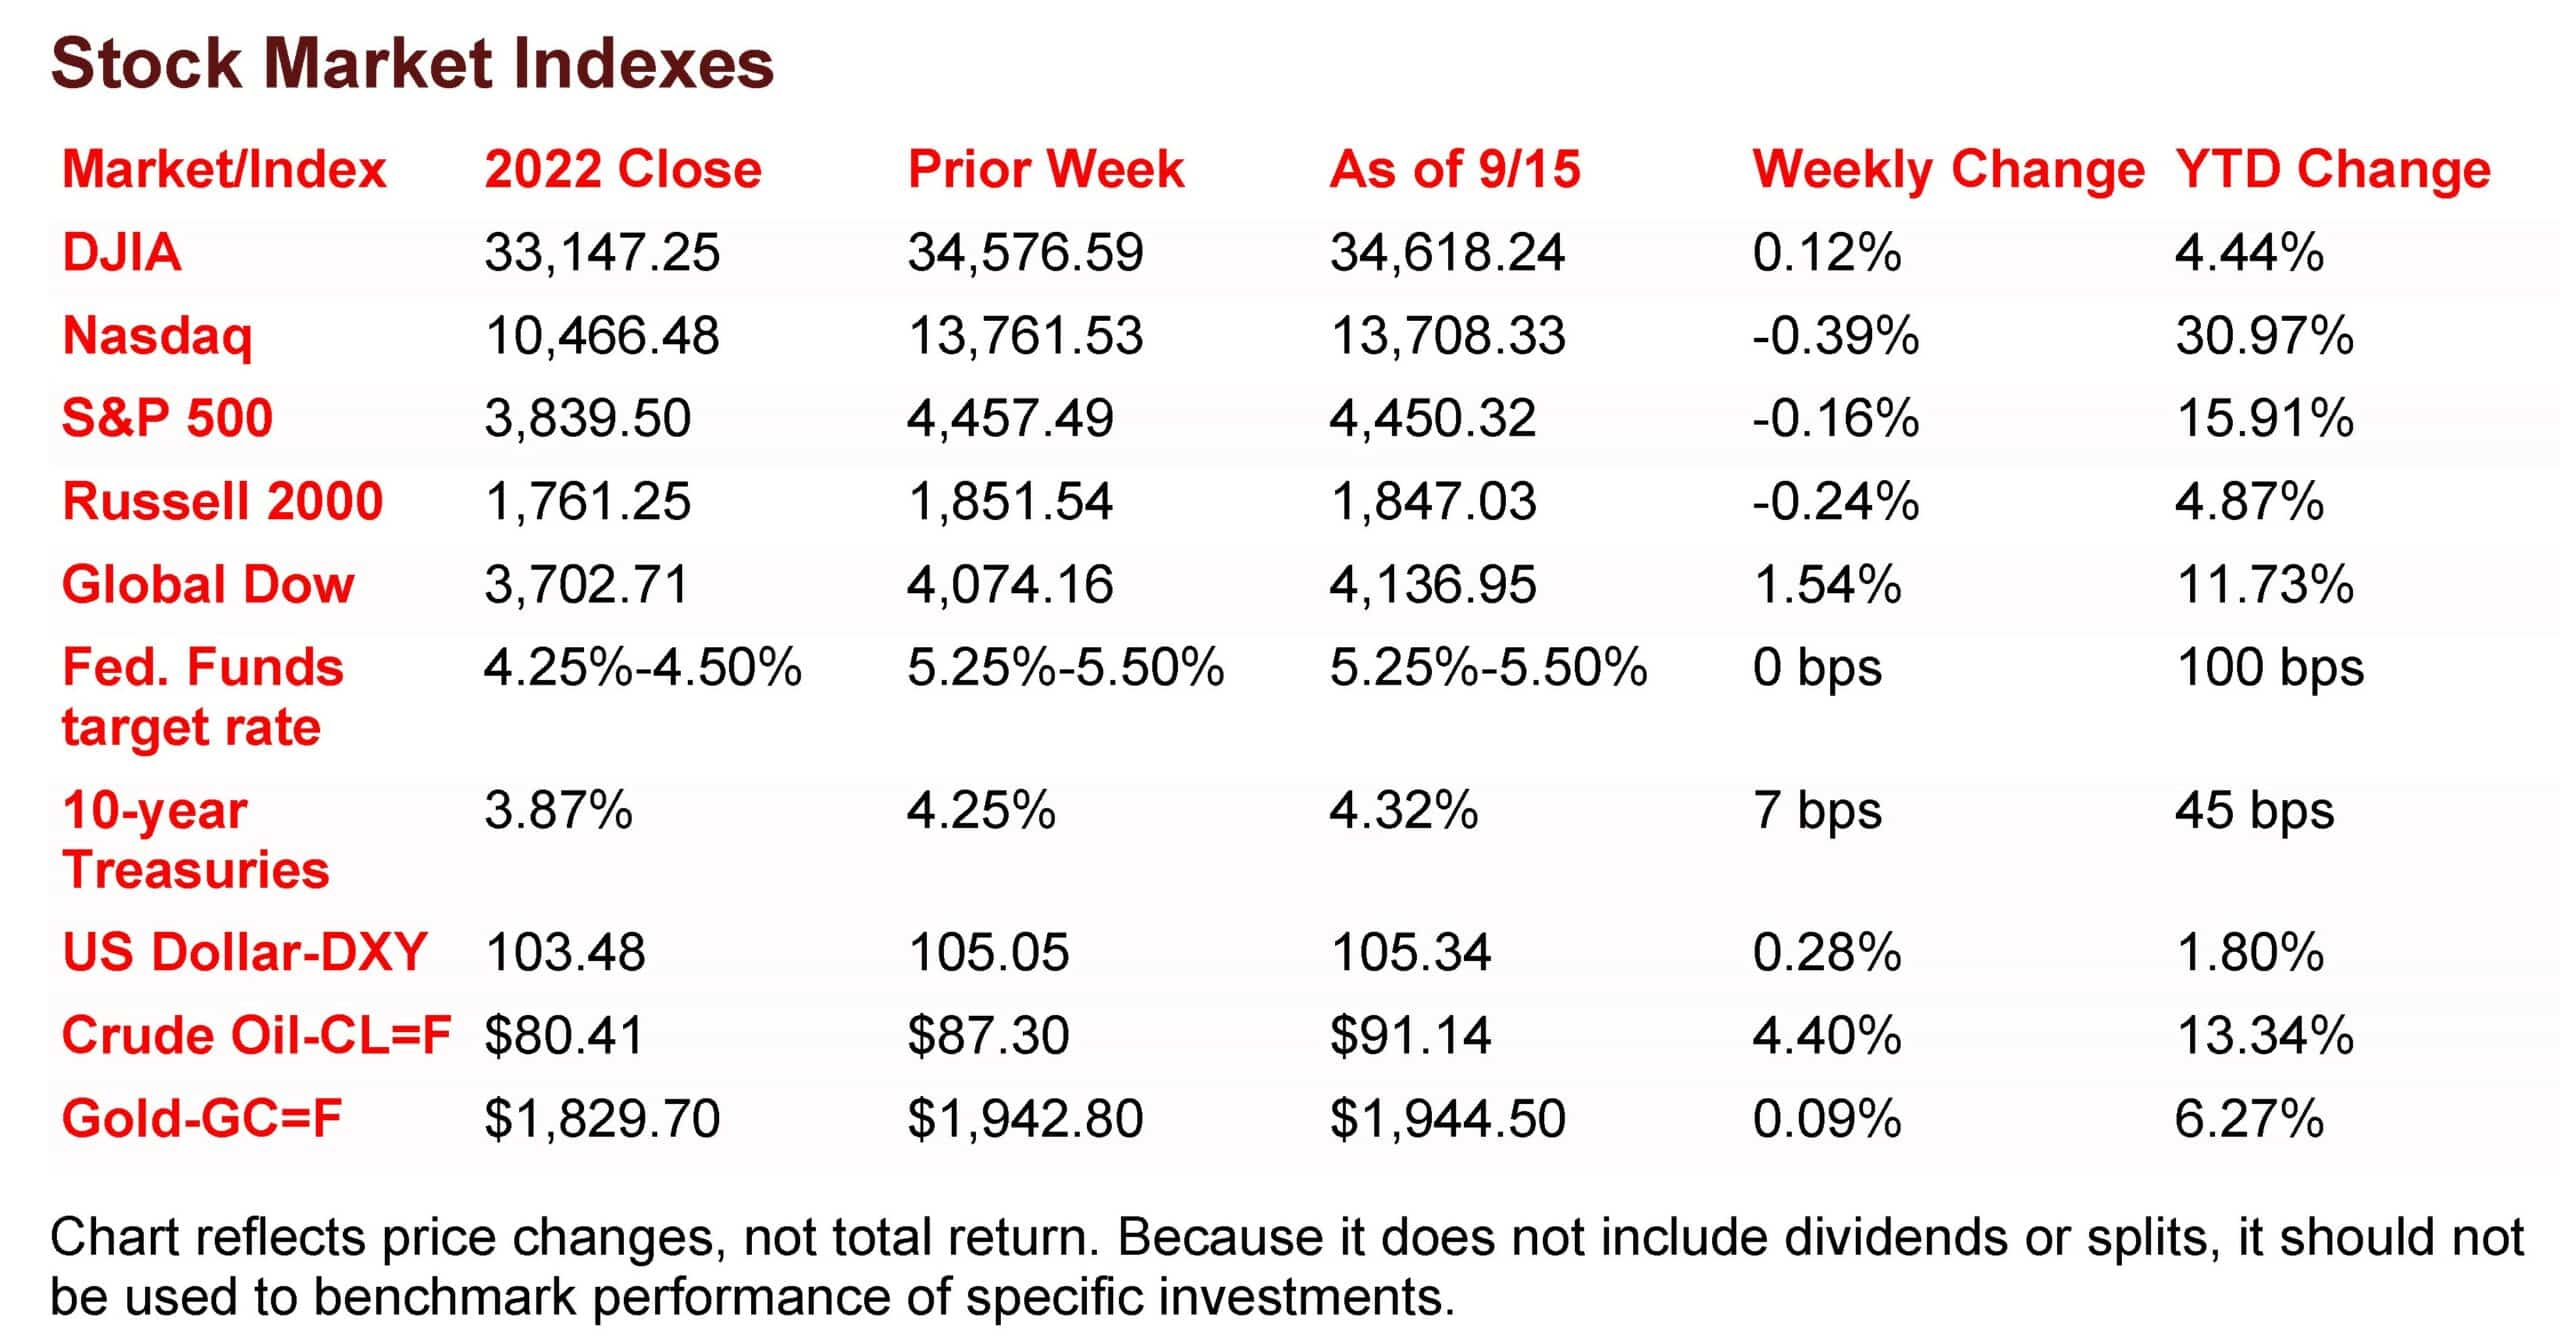
The Markets (as of market close September 15, 2023)
The markets turned in a lackluster week, with only the Dow able to eke out a gain. The remaining benchmark indexes listed here lost value as investors tried to digest mixed economic data, this week’s Federal Reserve meeting, and the impact of the United Auto Workers (UAW) strike. Ten-year Treasury yields settled at 4.32%, the third-highest yield of the year. Rising long-term rates generally impact growth stocks, such as tech shares, by potentially lowering the value of future profits. While most of the market sectors gained ground last week, information technology fell 2.0%. Crude oil prices vaulted past the $90.00 per barrel mark, driven by output cuts from Saudi Arabia and Russia against a backdrop of surging global consumption.
Wall Street kicked off last week on a high note as stocks bounced back from the previous week’s declines. Consumer discretionary and communications led the market sectors, driving each of the benchmark indexes listed here higher. The Nasdaq climbed 1.1%, followed by the Global Dow (0.8%), the S&P 500 (0.7%), the Dow (0.3%), and the Russell 2000 (0.2%). The dollar and crude oil prices declined, while gold prices inched higher. Ten-year Treasury yields settled at 4.28% after adding 3.0 basis points on the day.
Tech stocks underperformed last Tuesday, sending stocks lower. Investors also geared up for Wednesday’s Consumer Price Index, which was expected to show inflation tick higher due to rising energy prices. The Nasdaq slid 1.0% and the S&P 500 fell 0.6%. The Dow and the Global Dow lost 0.1%. The Russell 2000 ended the session flat. Yields on 10-year Treasuries dipped 2.4 basis points to 4.26%. Crude oil prices surged 1.8%, settling at $88.89 per barrel. The dollar inched higher, while gold prices fell 0.6%.
The markets closed mixed last Wednesday following the release of the Consumer Price Index (see below). As predicted, rising gasoline prices pushed the CPI up to 3.7% on an annual basis, giving the Federal Reserve reason to keep interest rates unchanged following this week’s meeting. Interest-rate sensitive growth stocks including tech and communications shares, rose higher, while industrials, real estate, materials, and energy floundered. By the close of trading, the Nasdaq rose 0.3% and the S&P 500 inched up 0.1%. The Russell 2000 fell 0.8%, the Dow dipped 0.2%, and the Global Dow was flat. Ten-year Treasury yields slipped to 4.24%. Crude oil prices edged down 0.1% to $88.77 per barrel. The dollar gained 0.1%, while gold prices fell 0.2%.
Wall Street rebounded last Thursday, with each of the benchmark indexes listed here climbing higher. The Russell 2000 led the way, gaining 1.4%, while the Dow and the Global Dow advanced 1.0%. The S&P 500 and the Nasdaq rose 0.8%. Investors may have seen a rise in inflation data as support for the Federal Reserve to “pause” interest-rate hikes. Markets chose to ignore the 10th straight interest-rate increase by the European Central Bank, as all 11 market sectors finished higher. Crude oil prices soared 2.2%, reaching $90.44 per barrel, marking the first time prices surpassed $90.00 per barrel since November 2022. The yield on 10-year Treasuries added 3.9 basis points to settle at 4.28%. The dollar advanced 0.5%, while gold prices were relatively flat.
Stocks slid lower to close out last week. The Nasdaq fell 1.6%, the S&P 500 lost 1.2%, the Russell 2000 declined 1.1%, the Dow declined 0.8%, and the Global Dow dipped 0.3%. Investors may have been a bit skiddish as they await this week’s Federal Reserve meeting. Also, a partial strike by United Auto Workers(UAW) may have weighed on investors. Crude oil continued to climb higher as prices rose over $91.00 per barrel. The dollar ticked lower, while gold prices advanced by 0.6%. Ten-year Treasury yields ended the session at 4.32%.
Last Week’s Economic News
The Consumer Price Index rose 0.6% in August after increasing 0.2% in July. Surging gasoline prices accounted for more than half of the overall CPI increase. Also contributing to the August monthly increase was continued advancement in shelter prices, which rose for the 40th consecutive month. Food prices increased 0.2% in August, matching the July advance. Consumer prices less food and energy (core prices) rose 0.3% in August, following a 0.2% increase in July. Since August 2022, the CPI has increased 3.7%, a larger increase than the 3.2% advance for the 12 months ended in July. Over the 12 months ended in August, core prices rose 4.3%, down from 4.7% for the 12 months ended in July. Since August 2022, prices for food rose 4.3%, new vehicles increased 2.9%, used cars and trucks fell 6.6%, apparel rose 3.1%, and shelter advanced 7.3%. Despite the recent increase in oil and gas prices, energy prices were down 3.6% since last August.
The Producer Price Index increased 0.7% in August following a 0.4% jump in the previous month. The August advance is the largest since June 2022. Producer prices have risen 1.6% for the 12 months ended in August. Producer prices for goods increased 2.0% last month, accounting for 80.0% of the August jump in the PPI. Over 60.0% of the August rise in goods prices can be traced to a 20.0% increase in prices for gasoline. Prices for services inched up 0.2% in August. Producer prices less foods, energy, and trade services increased 0.3% in August, the same as in July. For the 12 months ended in August, prices less foods, energy, and trade services rose 3.0%, the largest advance since moving up 3.4% for the 12 months ended in April.
Retail and food services sales rose 0.6% in August from the previous month, and 2.5% since August 2022. Retail trade sales also increased 0.6% last month and are up 1.6% over the last 12 months. Of particular note, gasoline station sales were down 10.3% from last year, while sales at food services and drinking places were up 8.5% and nonstore retail sales increased 7.2%.
Both import and export prices advanced in August. Import prices rose 0.5% last month after ticking up 0.1% in July. The August increase in import prices was the largest since May 2022. Fuel prices, which increased 6.7%, contributed to the jump in import prices. Excluding fuel, import prices actually declined 0.1%. Despite the increase last month, import prices are down 3.0% since August 2022. Export prices climbed 1.3% in August, the largest one-month increase since May 2022. Higher nonagricultural prices, led by rising costs for industrial supplies and materials, more than offset a decline in agricultural prices. Since August 2022, export prices have fallen 5.5%.
Industrial production increased 0.4% in August and manufacturing output inched up 0.1%. The August reading for manufacturing was held back by a drop of 5.0% in the output of motor vehicles and parts; otherwise, factory output rose 0.6%. Mining advanced 1.4% and utilities climbed 0.9%. Total industrial production in August was 0.2% above its August 2022 level.
The federal government monthly deficit decreased $89.3 billion in August. Government receipts were $283.1 billion, an increase of about $7.0 billion from the previous month. Government outlays were $193.9 billion, a decrease of $303.0 billion from July. For fiscal year 2023, the deficit sits at $1.5 trillion, $945.7 billion greater than the same period for fiscal year 2022.
The national average retail price for regular gasoline was $3.822 per gallon on September 11, $0.015 per gallon higher than the prior week’s price and $0.132 more than a year ago. Also, as of September 11, the East Coast price decreased $0.022 to $3.633 per gallon; the Midwest price rose $0.053 to $3.683 per gallon; the Gulf Coast price edged up $0.002 to $3.366 per gallon; the Rocky Mountain price increased $0.014 to $4.013 per gallon; and the West Coast price advanced $0.057 to $4.969 per gallon.
For the week ended September 9, there were 220,000 new claims for unemployment insurance, an increase of 3,000 from the previous week’s level, which was revised up by 1,000. According to the Department of Labor, the advance rate for insured unemployment claims for the week ended September 2 was 1.1%, unchanged from the previous week’s rate. The advance number of those receiving unemployment insurance benefits during the week ended September 2 was 1,688,000, an increase of 4,000 from the previous week’s level, which was revised up by 5,000. States and territories with the highest insured unemployment rates for the week ended August 26 were in New Jersey (2.6%), Hawaii (2.3%), California (2.2%), Rhode Island (2.1%), Connecticut (1.9%), Massachusetts (1.9%), New York (1.9%), Puerto Rico (1.9%), Oregon (1.7%), Minnesota (1.6%), and Pennsylvania (1.6%). The largest increases in initial claims for unemployment insurance for the week ended September 2 were in Missouri (+3,215), Indiana (+693), California (+556), Connecticut (+465), and Washington (+446), while the largest decreases were in Ohio (-2,759), New York (-2,228), Oregon (-804), Florida (-581), and Michigan (-532).
Eye on the Week Ahead
August data on the housing sector is available this week with reports on housing starts and existing home sales. The United Auto Workers (UAW) partial strike’s impact on financial markets and the broader economy varies with factors such as duration and scale. It could significantly affect the stock prices of involved automakers, potentially decreasing revenues and profits due to production and supply chain disruptions. Economic growth may be weighed down as the automotive industry plays a vital role in GDP, employment, and manufacturing. Consumers may experience reduced vehicle availability and higher prices. However, most attention will be focused on the Federal Open Market Committee meeting, which ends on Wednesday. Several strategists estimate a 50% whether the Fed will hike interest rates at this time.
Key Dates/Data Releases
- 9/19: Housing starts
- 9/20: FOMC statement
- 9/21: Existing home sales
Scarlet Oak Financial Services can be reached at 800.871.1219 or contact us here. Click here to sign up for our weekly newsletter with the latest economic news.
Data sources:
Economic: Based on data from U.S. Bureau of Labor Statistics (unemployment, inflation); U.S. Department of Commerce (GDP, corporate profits, retail sales, housing); S&P/Case-Shiller 20-City Composite Index (home prices); Institute for Supply Management (manufacturing/services). Performance: Based on data reported in WSJ Market Data Center (indexes); U.S. Treasury (Treasury yields); U.S. Energy Information Administration/Bloomberg.com Market Data (oil spot price, WTI, Cushing, OK); www.goldprice.org (spot gold/silver); Oanda/FX Street (currency exchange rates).
News items are based on reports from multiple commonly available international news sources (i.e., wire services) and are independently verified when necessary with secondary sources such as government agencies, corporate press releases, or trade organizations. All information is based on sources deemed reliable, but no warranty or guarantee is made as to its accuracy or completeness. Neither the information nor any opinion expressed herein constitutes a solicitation for the purchase or sale of any securities, and should not be relied on as financial advice.
Forecasts are based on current conditions, subject to change, and may not come to pass. U.S. Treasury securities are guaranteed by the federal government as to the timely payment of principal and interest. The principal value of Treasury securities and other bonds fluctuates with market conditions. Bonds are subject to inflation, interest-rate, and credit risks. As interest rates rise, bond prices typically fall. A bond sold or redeemed prior to maturity may be subject to loss. Past performance is no guarantee of future results. All investing involves risk, including the potential loss of principal, and there can be no guarantee that any investing strategy will be successful.
The Dow Jones Industrial Average (DJIA) is a price-weighted index composed of 30 widely traded blue-chip U.S. common stocks. The S&P 500 is a market-cap weighted index composed of the common stocks of 500 largest, publicly traded companies in leading industries of the U.S. economy. The NASDAQ Composite Index is a market-value weighted index of all common stocks listed on the NASDAQ stock exchange. The Russell 2000 is a market-cap weighted index composed of 2,000 U.S. small-cap common stocks. The Global Dow is an equally weighted index of 150 widely traded blue-chip common stocks worldwide. The U.S. Dollar Index is a geometrically weighted index of the value of the U.S. dollar relative to six foreign currencies. Market indexes listed are unmanaged and are not available for direct investment.
Broadridge Investor Communication Solutions, Inc. prepared this material for use by Scarlet Oak Financial Services.
Broadridge Investor Communication Solutions, Inc. does not provide investment, tax, legal, or retirement advice or recommendations. The information presented here is not specific to any individual’s personal circumstances. To the extent that this material concerns tax matters, it is not intended or written to be used, and cannot be used, by a taxpayer for the purpose of avoiding penalties that may be imposed by law. Each taxpayer should seek independent advice from a tax professional based on individual circumstances. Scarlet Oak Financial Services provides these materials for general information and educational purposes based upon publicly available information from sources believed to be reliable — we cannot assure the accuracy or completeness of these materials. The information in these materials may change at any time and without notice.
