
Market Week: February 27, 2023
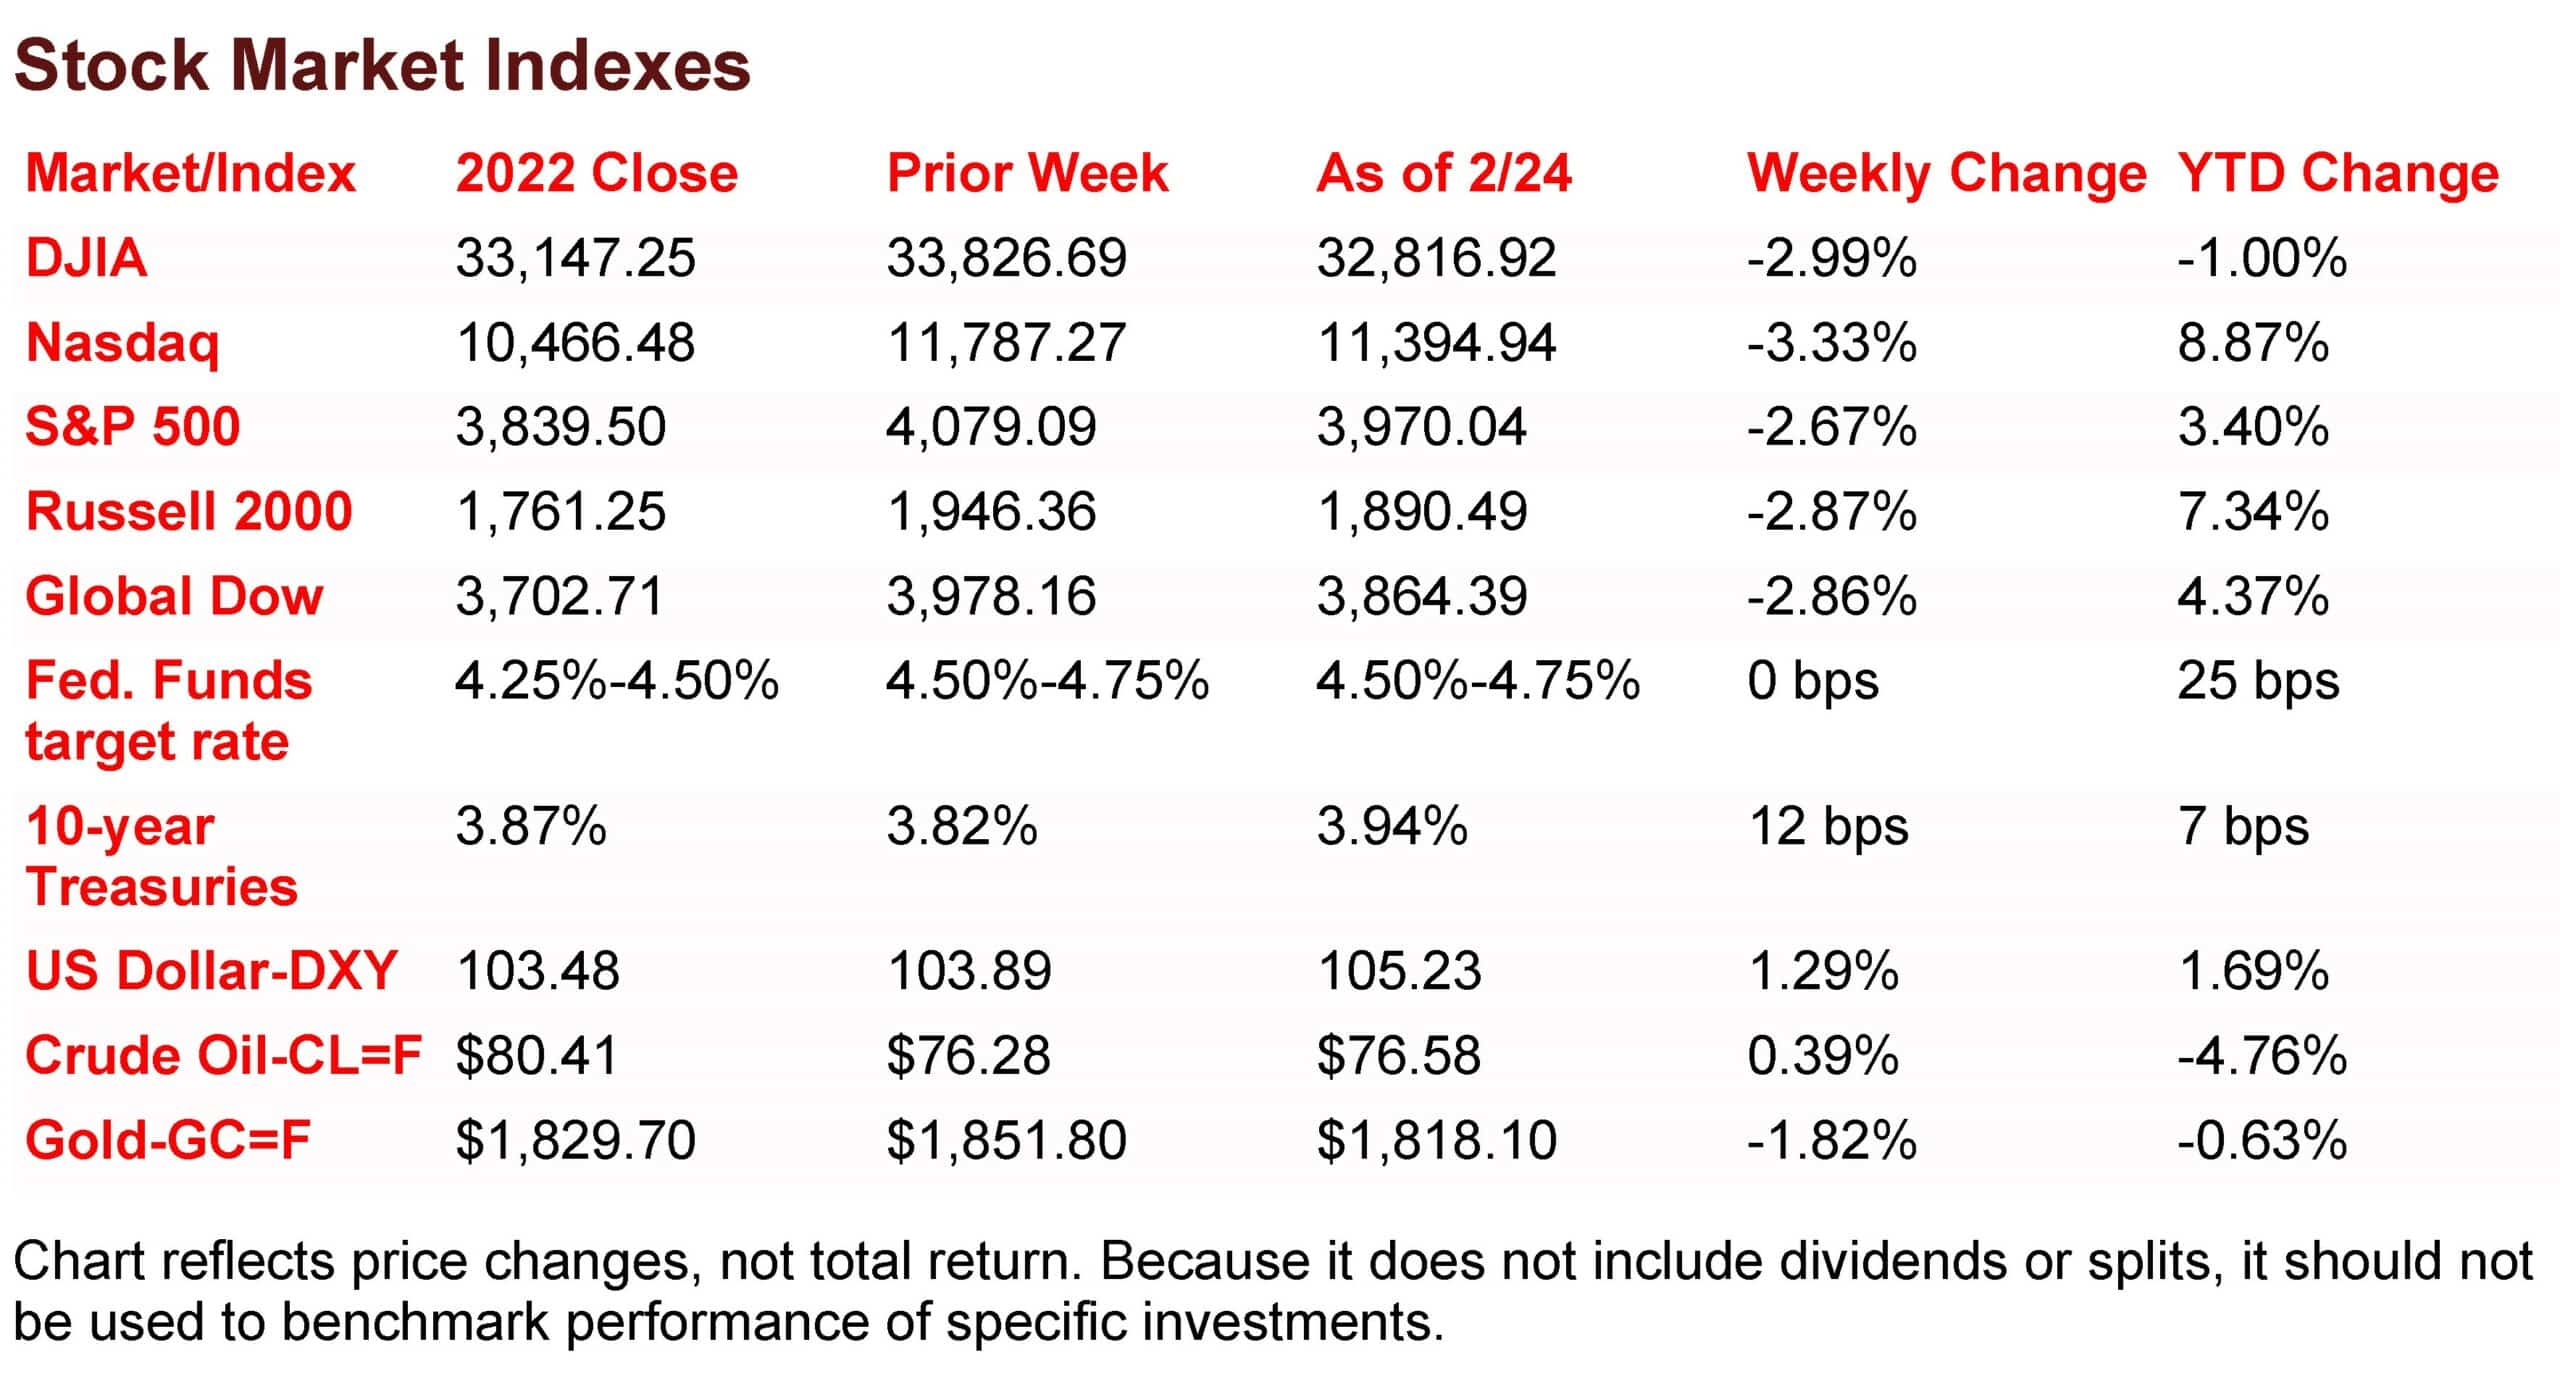
The Markets (as of market close February 24, 2023)
Wall Street reacted negatively to hotter-than-expected inflation data at the end of last week. Each of the benchmark indexes listed here closed lower, with the Nasdaq falling more than 3.3%, while the remaining indexes suffered losses close to 3.0%. The S&P 500 endured its worst week in 2023, while Treasury yields climbed higher, as bond prices fell on weakened demand. The dollar advanced, gold prices sank, and crude oil prices ended last week marginally higher following a late-week surge. With the latest inflation data for January out, investors expect the Federal Reserve to ramp up interest rates in both amount and duration.
With the markets closed last Monday for Presidents’ Day, Wall Street opened last Tuesday on a sour note, with stocks recording their worst day in two months. The Chicago Board Options Exchange (CBOE) Volatility Index rose above 23.0, its second-highest level of the year, before settling marginally lower. The Global Dow dipped 1.3%, which was the smallest loss among the benchmark indexes listed here. The remaining indexes fell by at least 2.0%, with the Russell 2000 (-3.0%) and the Nasdaq (-2.5%) falling the furthest. The S&P 500 and the Dow fell 2.0%. Bond prices sagged, with the yield on 10-year Treasuries climbing 12.7 basis points to 3.95% — the highest rate since November. With recent economic data continuing to show at least moderate strength and consumer prices rising, investors saw the Federal Reserve poised to continue to hike interest rates for the foreseeable future. The dollar climbed higher, while gold prices fell. Crude oil prices dropped more than a quarter of a percent to $76.05 per barrel.
Stocks ended last Wednesday mixed, with the Nasdaq (0.1%) and the Russell 2000 (0.3%) closing higher, while the Global Dow (-0.8%), the Dow (-0.3%), and the S&P 500 (-0.2%) closed lower. Investors pored over the minutes from the last meeting of the Federal Open Market Committee, held earlier this month, to gauge where the Committee may be headed with further interest rate hikes. Ten-year Treasury yields dipped lower, closing at 3.92%. Crude oil prices continued to slide, falling to $73.91 per barrel. The dollar advanced, while gold prices declined.
Investors saw stocks rebound last Thursday, ending four sessions of middling to declining returns. The large caps of the S&P 500 gained 0.5% and the Dow rose 0.3% by the close of a back-and-forth day of trading. The Nasdaq and the Russell 2000 advanced 0.7% to top the benchmark indexes listed here. The Global Dow ended the day flat. Ten-year Treasury yields fell 4.4 basis points to 3.87% as bond prices increased. Crude oil ended a streak of losses, gaining 2.2% to reach $75.57 per barrel. The dollar edged lower, while gold prices lost nearly $11.00, falling to $1,830.60 per ounce.
A rise in consumer prices was enough to pull stocks lower last Friday. Each of the benchmark indexes listed here ended the day in the red, with the Nasdaq falling 1.7%. The Global Dow dipped 1.2%, followed by the S&P 500 (-1.1%), the Dow (-1.0%), and the Russell 2000 (-0.9%). Ten-year Treasury yields added 7.0 basis points to reach 3.94%. The dollar jumped 0.6%, while gold prices fell 0.5%. Crude oil prices rose for the second straight day, closing at about $76.58 per barrel.
 Last Week’s Economic News
The second estimate of fourth-quarter gross domestic product showed the economy advanced at an annual rate of 2.7%. In the third quarter, GDP increased 3.2%. The initial estimate showed GDP advanced at a rate of 2.9%. The decrease in the estimates is largely attributable to a decrease in personal consumption expenditures, which advanced 1.4%, according to the second iteration. The initial estimate had personal consumption expenditures increasing 2.1%. Spending on durable goods fell 1.8% from the third quarter, nondurables increased 0.2%, while spending on services rose 2.4%. The increase in GDP in the fourth quarter reflected increases in private inventory investment, consumer spending, nonresidential fixed investment, federal government spending, and state and local government spending that were partly offset by decreases in residential fixed investment and exports. Imports, which are a negative in the calculation of GDP, decreased. The personal consumption expenditures price index, a measure of inflation, increased 3.7% in the fourth quarter, following a 4.3% increase in the third quarter.
The Personal Consumption Expenditures (PCE) Price Index for January rose 0.6%, in line with other inflation data for that month. Excluding food and energy, the PCE price index also increased 0.6%. The PCE price index was 5.4% above the January 2022 rate, up 0.1 percentage point from the 12-months ended December 2021. Personal consumption expenditures increased 1.8% in January, after falling 0.2% and 0.1% in November and December, respectively. Personal income rose 0.6% in January, while disposable personal income increased 2.0%.
Sales of existing homes fell for the 12th consecutive month in January, after declining 0.7% from December’s total. Since January 2022, existing home sales are down 36.9%. Total housing inventory sits at a supply of 2.9 months at the current sales pace, unchanged from the December pace. Rising mortgage rates and low inventory have contributed to the decline in existing home sales. According to the data from the National Association of Realtors®, the 30-year fixed-rate mortgage (Freddie Mac) averaged 6.50% as of February 23. That’s up from 6.32% from the previous week and 3.89% from one year ago. The median existing-home price in January was $359,000, down from $366,500 in December, but higher than the January 2022 price of $354,300. Sales of existing single-family homes also declined in January, down 0.8% from the previous month and 36.1% from January 2022. The median existing single-family home price in January was $363,100, lower than the December price of $372,000, but up from the January 2022 price of $360,700.
While sales of existing homes continued to fall in January, sales of new single-family homes advanced for the second consecutive month, after advancing 7.2% from December. Unsold inventory was at a 7.9-month rate in January, well above the inventory of existing homes. New home prices declined in January. The median price for new single-family homes for sale was $427,500, down from the December price of $465,600, and under the January 2022 price of $430,500. The average price was $474,400, lower than the December price of $544,200, and less than the January 2022 price of $501,200.
Average regular retail gas prices slid lower throughout much of the United States last week. The national average retail price for regular gasoline was $3.379 per gallon on February 20, $0.011 per gallon less than the prior week’s price and $0.151 less than a year ago. Also, as of February 20, the East Coast price decreased $0.048 to $3.291 per gallon; the Gulf Coast price dipped $0.011 to $3.007 per gallon; the Midwest price fell $0.016 to $3.220 per gallon; the West Coast price increased $0.083 to $4.189 per gallon; and the Rocky Mountain price increased $0.061 to $3.826 per gallon. Residential heating oil prices averaged $4.266 per gallon on February 20, $0.122 below the previous week’s price, but $0.310 per gallon more than a year ago.
For the week ended February 18, there were 192,000 new claims for unemployment insurance, a decrease of 3,000 from the previous week’s level, which was revised up by 1,000. According to the Department of Labor, the advance rate for insured unemployment claims for the week ended February 1 was 1.1%, a decrease of 0.1 percentage point from the previous week’s rate. The advance number of those receiving unemployment insurance benefits during the week ended February 11 was 1,654,000, a decrease of 37,000 from the previous week’s level, which was revised down by 5,000. States and territories with the highest insured unemployment rates for the week ended February 4 were New Jersey (2.7%), Rhode Island (2.5%), Minnesota (2.4%), California (2.3%), Massachusetts (2.3%), Alaska (2.1%), Montana (2.1%), Illinois (2.0%), Puerto Rico (2.0%), and New York (1.9%). The largest increases in initial claims for unemployment insurance for the week ended February 11 were in Ohio (+1,855), Michigan (+1,350), Massachusetts (+743), Texas (+702), and Minnesota (+683), while the largest decreases were in California (-4,297), Pennsylvania (-2,594), Illinois (-1,956), Kansas (-985), and Iowa (-723).
Eye on the Week Ahead
This week, most of the economic data will focus on the purchasing managers’ assessments of the manufacturing and services sectors in February. January saw both manufacturing and services contract from the previous month, primarily due to a decrease in new orders.
Key Dates/Data Releases
- 2/27: Durable goods orders
- 2/28: International trade in goods
- 3/1: S&P Purchasing Managers’ Manufacturing Index
- 3/3: S&P Purchasing Managers’ Services Index
Need some tax help? Check out Scarlet Oak’s tax center with tips, key numbers for this and last year, 1099 information, and more.
Scarlet Oak Financial Services can be reached at 800.871.1219 or contact us here. Click here to sign up for our weekly newsletter with the latest economic news.
Data sources: Economic: Based on data from U.S. Bureau of Labor Statistics (unemployment, inflation);
U.S. Department of Commerce (GDP, corporate profits, retail sales, housing); S&P/Case-Shiller 20-City Composite Index (home prices); Institute for Supply Management (manufacturing/services). Performance: Based on data reported in WSJ Market Data Center (indexes); U.S. Treasury (Treasury yields); U.S. Energy Information Administration/Bloomberg.com Market Data (oil spot price, WTI, Cushing, OK); www.goldprice.org (spot gold/silver); Oanda/FX Street (currency exchange rates). News items are based on reports from multiple commonly available international news sources (i.e., wire services) and are independently verified when necessary with secondary sources such as government agencies, corporate press releases, or trade organizations. All information is based on sources deemed reliable, but no warranty or guarantee is made as to its accuracy or completeness. Neither the information nor any opinion expressed herein constitutes a solicitation for the purchase or sale of any securities, and should not be relied on as financial advice. Forecasts are based on current conditions, subject to change, and may not come to pass. U.S. Treasury securities are guaranteed by the federal government as to the timely payment of principal and interest. The principal value of Treasury securities and other bonds fluctuates with market conditions. Bonds are subject to inflation, interest-rate, and credit risks. As interest rates rise, bond prices typically fall. A bond sold or redeemed prior to maturity may be subject to loss. Past performance is no guarantee of future results. All investing involves risk, including the potential loss of principal, and there can be no guarantee that any investing strategy will be successful.
The Dow Jones Industrial Average (DJIA) is a price-weighted index composed of 30 widely traded blue-chip U.S. common stocks. The S&P 500 is a market-cap weighted index composed of the common stocks of 500 largest, publicly traded companies in leading industries of the U.S. economy. The NASDAQ Composite Index is a market-value weighted index of all common stocks listed on the NASDAQ stock exchange. The Russell 2000 is a market-cap weighted index composed of 2,000 U.S. small-cap common stocks. The Global Dow is an equally weighted index of 150 widely traded blue-chip common stocks worldwide. The U.S. Dollar Index is a geometrically weighted index of the value of the U.S. dollar relative to six foreign currencies. Market indexes listed are unmanaged and are not available for direct investment.
Broadridge Investor Communication Solutions, Inc. prepared this material for use by Scarlet Oak Financial Services.
Broadridge Investor Communication Solutions, Inc. does not provide investment, tax, legal, or retirement advice or recommendations. The information presented here is not specific to any individual’s personal circumstances. To the extent that this material concerns tax matters, it is not intended or written to be used, and cannot be used, by a taxpayer for the purpose of avoiding penalties that may be imposed by law. Each taxpayer should seek independent advice from a tax professional based on individual circumstances. Scarlet Oak Financial Services provide these materials for general information and educational purposes based upon publicly available information from sources believed to be reliable — we cannot assure the accuracy or completeness of these materials. The information in these materials may change at any time and without notice.
