
The Markets (as of market close July 21, 2023)
Market Recap:
The labor market’s strength and lower-than-expected unemployment claims, a decrease of 9,000 from the previous week’s level, may reduce the likelihood of a recession. In anticipation of another rate hike from the Federal Reserve, investors shifted their focus from tech to more defensive sectors like healthcare and utilities. Bond prices held steady, and the dollar recovered from the previous week’s decline. Although retail sales and retail trade sales both grew by 0.2% in June, industrial production and existing home sales experienced a decline. This week, important economic reports will shed more light on the country’s financial health, including the second-quarter gross domestic product and the personal income and outlays report.
The Markets (as of market close July 21, 2023)
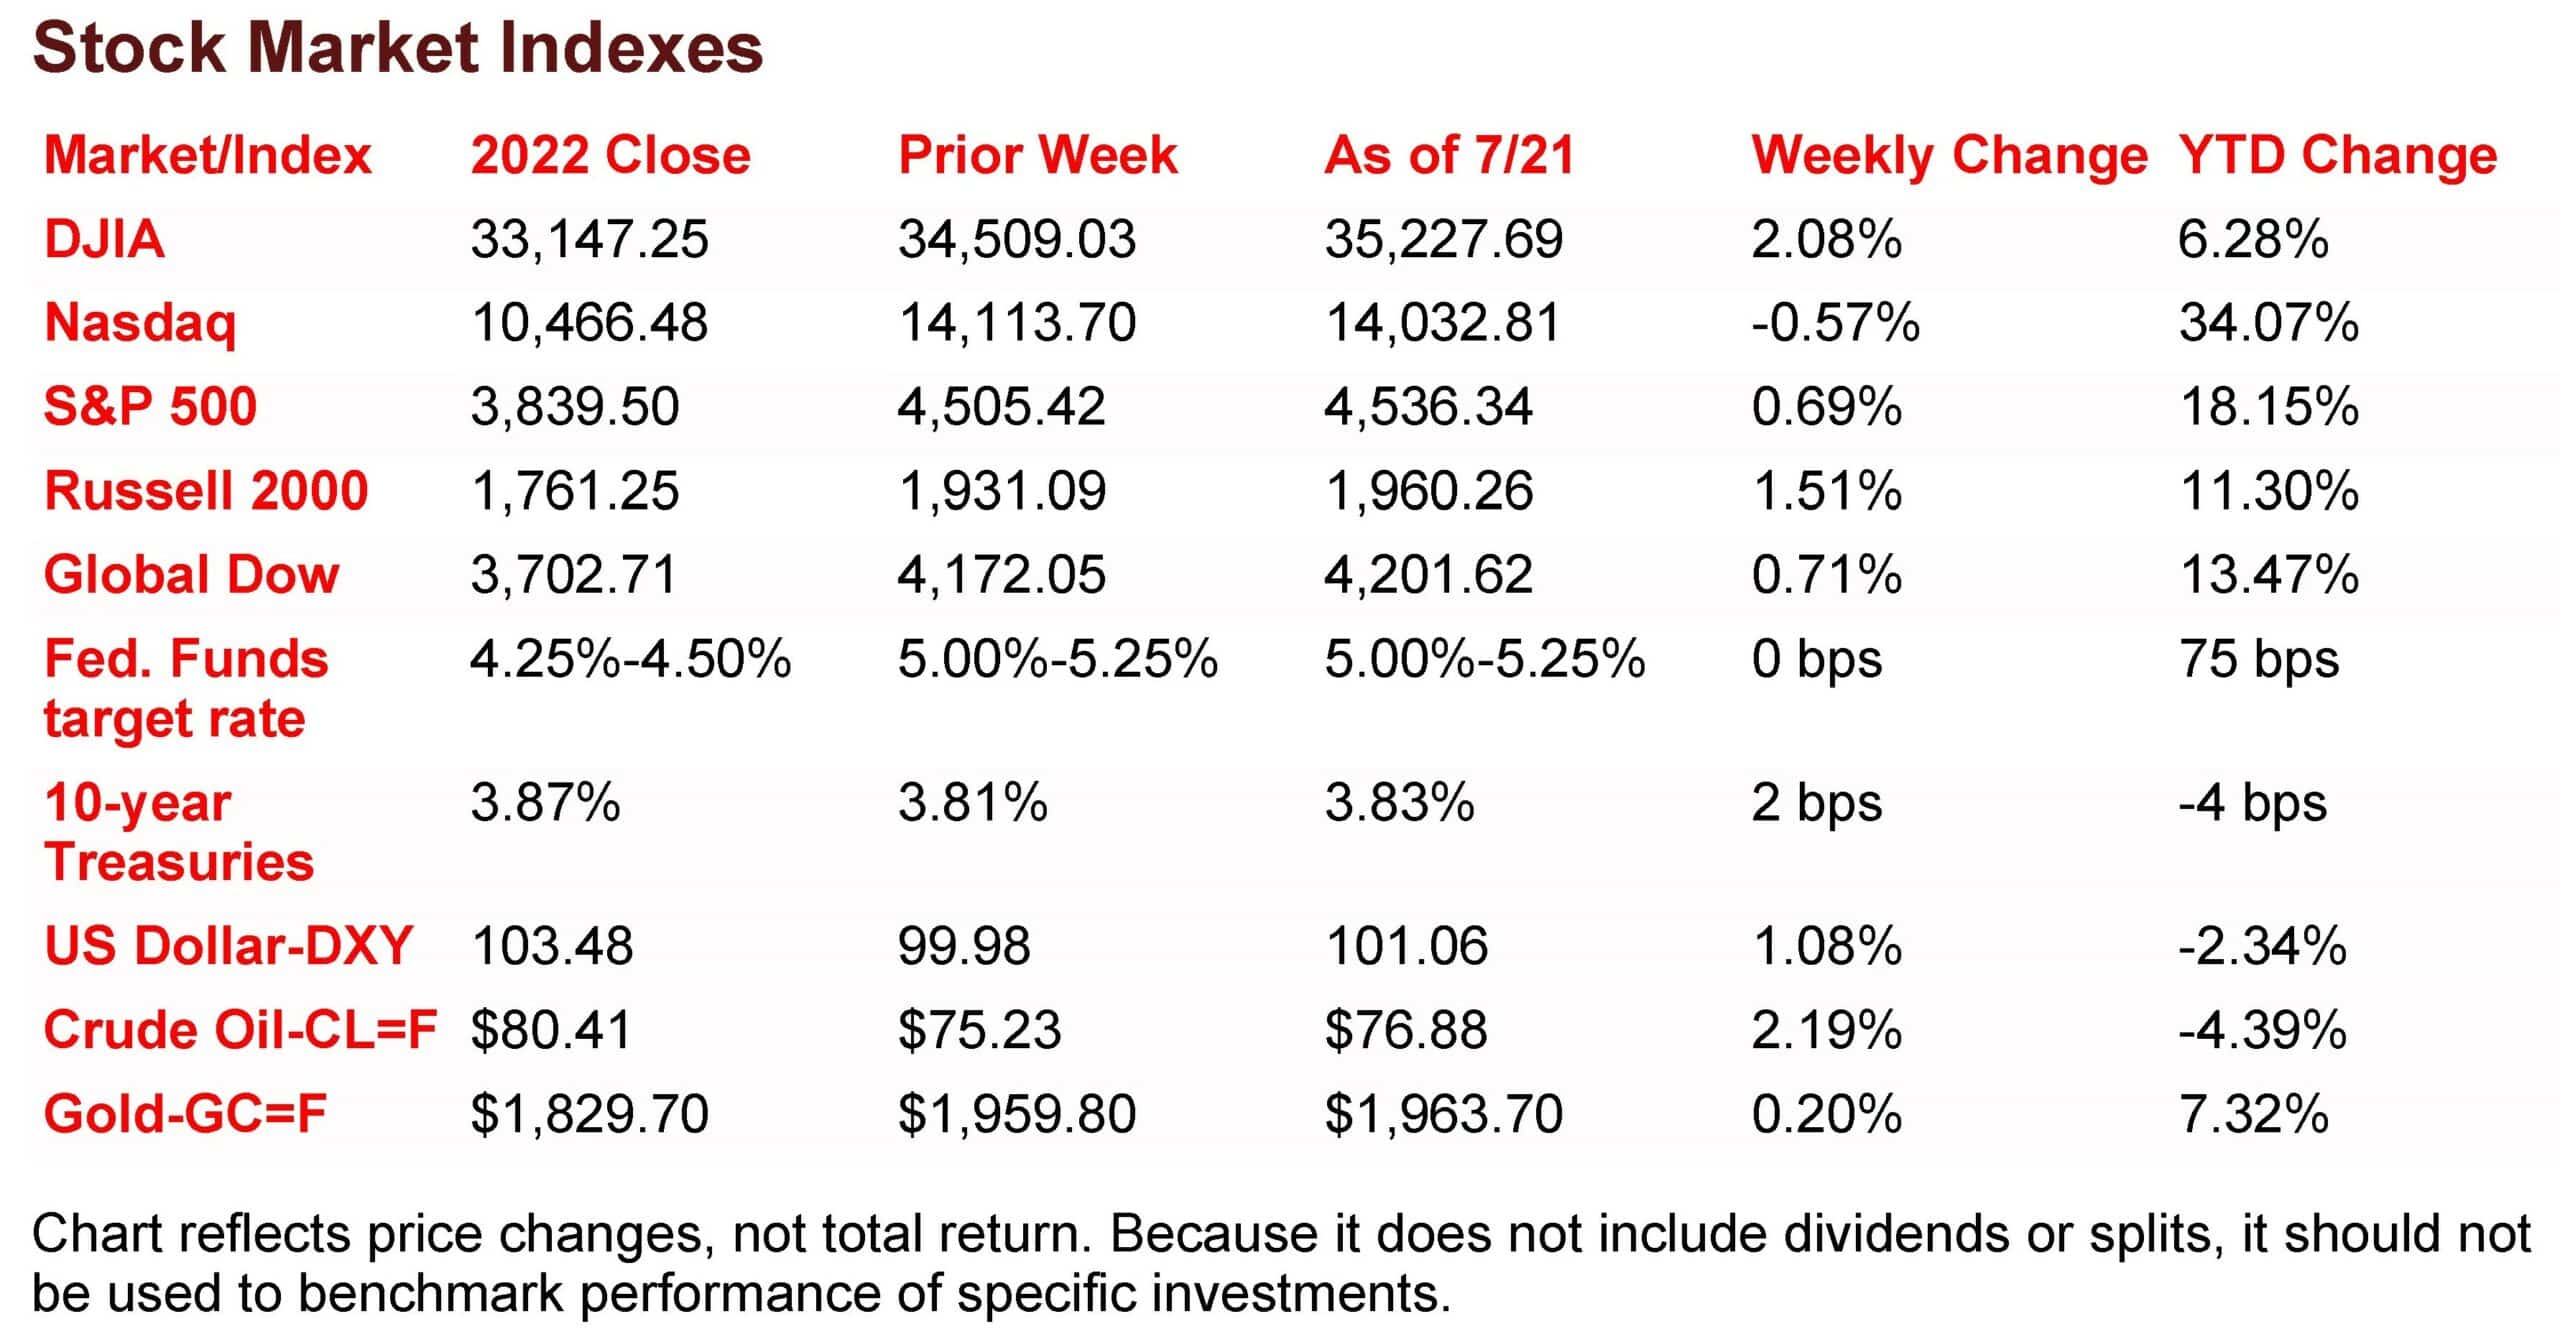
Last week saw stocks close generally higher, with only the tech-heavy Nasdaq slipping lower. The Dow extended its winning streak to 10 straight sessions, its longest run since August 2017. Investors, probably anticipating another 25.0 basis-point hike from the Federal Reserve this week, moved from information technology, communication services, and consumer discretionary shares to more defensive sectors such as health care, utilities, and consumer staples. Long-term bond prices remained relatively stable for the week, with yields on 10-year Treasuries inching up 2.0 basis points. The dollar rebounded last week after sliding over 2.0% the prior week. The labor market remained strong, with unemployment claims (see below) coming in lower than expected, which reduces the risk of recession and strengthens the dollar. Crude oil prices advanced again last week, keeping July’s streak of weekly increases intact.
Stocks opened higher to begin last week as investors looked ahead to the start of corporate earnings season. Traders looked past a disappointing report on China’s gross domestic product, instead focusing on hopes that waning inflation may quell fears of a recession. The small caps of the Russell 2000 gained 1.0% and the Nasdaq rose 0.9% to lead the benchmark indexes listed here. The S&P 500 advanced 0.4% and the Dow inched up 0.2%. The Global Dow ended the session flat. Ten-year Treasury yields fell 2.2 basis points to 3.79%. Crude oil prices slid 1.8%, falling to $74.09 per barrel on reports that Kuwait plans to boost its crude oil production. The dollar ended the day where it began, while gold prices dipped 0.3%.
Last Tuesday saw stocks close higher, with the Dow reaching a one-year high. Information technology, energy, and financials led the market sectors. A couple of major financial corporations posted favorable earnings to help propel bank shares. The Russell 2000 led the benchmark indexes for the second straight session, gaining 1.3%, followed by the Dow (1.1%) and the Nasdaq (0.8%). The Global Dow and the S&P 500 advanced 0.7%. Ten-year Treasury yields ticked lower, closing at 3.78%. Crude oil prices shrugged off the prior day’s declines, gaining 2.1% to settle at $75.71 per barrel. The dollar inched higher, while gold prices rose 1.3%.
Stocks finished higher last Wednesday for the third straight session. Tech shares lagged a bit, but consumer staples, financials, energy, and health care advanced. The Nasdaq ended the day flat, while the Russell 2000 (0.5%), the Dow (0.3%).The Global Dow and the S&P 500 edged 0.2% higher. Data in the United Kingdom showed inflation slowed somewhat, which impacted long-term bonds. The yield on 10-year Treasuries fell 4.7 basis points, closing at 3.74%. Crude oil prices continued to ride a bumpy wave, following the prior day’s advance by sliding 0.6% settling at $75.27 per barrel. The dollar edged higher, while gold prices were unchanged by the close of trading.
Wall Street closed generally lower last Thursday. The Dow advanced for the ninth straight session after gaining 0.5%, marking its longest winning streak since 2017. The Nasdaq (-2.1%), the Russell 2000 (-1.0%), and the S&P 500 (-0.7%) declined. The Global Dow was flat. Consumer discretionary, information technology, and communication services lost ground, while health care, utilities, and energy were strong performers. Ten-year Treasury yields, pushed higher by sagging bond prices, climbed 11.2 basis points to close at 3.85%. Crude oil prices settled at $75.63 per barrel, up 0.4% on the day. The dollar advanced over 0.5%, while gold prices dipped lower.
Stocks ended last Friday with mixed returns. The Dow barely edged higher to maintain its bull run. Investors moved from information technology and communication services to more defensive sectors such
as utilities and health care. The Nasdaq fell for the second consecutive day, falling 0.2%, while the small caps of the Russell 2000 dipped 0.4%. The Global Dow slid 0.2%. The S&P 500 ended the day relatively flat. Yields on 10-year Treasuries slipped lower, closing at 3.83%. Crude oil prices advanced 1.7%. The dollar inched up 0.2%, while gold prices fell 0.4% by the close of trading.
 Last Week’s Economic News
Retail sales inched up 0.2% in June and rose 1.5% since June 2022. Retail trade sales also increased 0.2% last month and were up 0.5% from a year ago. Retailers that enjoyed solid June sales included furniture and home furnishing stores; electronics and appliance stores; clothing and clothing accessories stores; miscellaneous store retailers; and nonstore retailers. Sales at general merchandise stores and department stores along with gasoline station sales slipped the most in June.
Industrial production edged down 0.5% in June, marking the second straight monthly decline. Manufacturing output dipped 0.3% last month, while mining and utilities fell 0.2% and 2.6%, respectively. Overall, total industrial production in June was 0.4% below its June 2022 level. Most major market groups posted declines in June. The indexes for nondurable manufacturing and durable manufacturing fell 0.6% and 0.1%, respectively.
The number of residential building permits issued in June declined 3.7% from the May total and is 15.3% below the June 2022 figure. Issued building permits for single-family housing increased 2.2% in June. Housing starts decreased 8.0% last month and were 8.1% below the total from a year earlier. Single-family housing starts in June were 7.0% below the prior month’s rate. Home completions dipped 3.3% in June from May but were 5.5% above the June 2022 total. Single-family home completions in June dipped 2.8% below May’s figure.
Sales of existing homes retreated 3.3% in June and 18.9% since June 2022. This year has not been a good one for sales of existing homes, as they are lower by 23.0% from the end of 2022. Total housing inventory sits at a 3.1-month supply at the current sales pace. The dearth of existing homes for sale coupled with rising mortgage rates has stifled sales. The median sales price for existing homes was $410,200 in June, the second-highest price all-time, just below the highest price of $413,800 in June 2022. Single-family home sales also fell last month, down 3.4% from May and 18.8% from a year earlier. The median price for single-family existing homes was $416,000 in June, down 1.2% from June 2022.
The national average retail price for regular gasoline was $3.559 per gallon on July 17, $0.013 per gallon higher than the prior week’s price but $0.931 less than a year ago. Also, as of July 17, the East Coast price decreased $0.007 to $3.422 per gallon; the Midwest price increased $0.051 to $3.413 per gallon; the Gulf Coast price fell $0.015 to $3.137 per gallon; the Rocky Mountain price rose $0.017 to $3.765 per gallon; and the West Coast price increased $0.015 to $4.549 per gallon.
For the week ended July 15, there were 228,000 new insured unemployment claims, a decrease of 9,000 from the previous week’s level. According to the Department of Labor, the advance rate for insured unemployment claims for the week ended July 8 was 1.2%, unchanged from the previous week’s rate. The advance number of those receiving unemployment insurance benefits during the week ended July 8 was 1,754,000, an increase of 33,000 from the previous week’s level, which was revised down by 8,000. States and territories with the highest insured unemployment rates for the week ended July 1 were Puerto Rico (2.4%), New Jersey (2.3%), California (2.1%), Connecticut (2.0%), Rhode Island (2.0%), Massachusetts (1.9%), New York (1.8%), Oregon (1.7%), Minnesota (1.6%), and Pennsylvania (1.6%). The largest increases in initial claims for unemployment insurance for the week ended July 8 were in New York (+8,043), Ohio (+1,783), Pennsylvania (+1,413), Iowa (+1,368), and Arizona (+1,118), while the largest decreases were in Connecticut (-3,538), New Jersey (-3,290), Michigan (-1,434), Minnesota (-758), and Rhode Island (-751).
Eye on the Week Ahead
This is a very noteworthy week for the release of important economic information. The initial estimate of second-quarter gross domestic product is released this week. The economy advanced at an annualized rate of 2.0% in the first quarter. Also out this week is the report on personal income and outlays, which includes the personal consumption expenditures price index, a preferred inflation indicator of the Federal Reserve. Prices inched up 0.1% in May and are expected to maintain a comparable pace in June. All of which leads to the July meeting of the Federal Open Market Committee. The FOMC passed on increasing interest rates following its June meeting, but the expectation is that the Committee will raise rates by at least 25.0 basis points in July.
Key Dates/Data Releases
- 7/26: New home sales, FOMC statement
- 7/27: Durable goods orders, GDP, international trade in goods
- 7/28: Personal income and outlays
Scarlet Oak Financial Services can be reached at 800.871.1219 or contact us here. Click here to sign up for our weekly newsletter with the latest economic news.
Data sources:
Economic: Based on data from U.S. Bureau of Labor Statistics (unemployment, inflation);
U.S. Department of Commerce (GDP, corporate profits, retail sales, housing); S&P/Case-Shiller 20-City Composite Index (home prices); Institute for Supply Management (manufacturing/services). Performance: Based on data reported in WSJ Market Data Center (indexes); U.S. Treasury (Treasury yields); U.S. Energy Information Administration/Bloomberg.com Market Data (oil spot price, WTI, Cushing, OK); www.goldprice.org (spot gold/silver); Oanda/FX Street (currency exchange rates). News items are based on reports from multiple commonly available international news sources (i.e., wire services) and are independently verified when necessary with secondary sources such as government agencies, corporate press releases, or trade organizations.
All information is based on sources deemed reliable, but no warranty or guarantee is made as to its accuracy or completeness. Neither the information nor any opinion expressed herein constitutes a solicitation for the purchase or sale of any securities, and should not be relied on as financial advice. Forecasts are based on current conditions, subject to change, and may not come to pass. U.S. Treasury securities are guaranteed by the federal government as to the timely payment of principal and interest. The principal value of Treasury securities and other bonds fluctuates with market conditions. Bonds are subject to inflation, interest-rate, and credit risks. As interest rates rise, bond prices typically fall. A bond sold or redeemed prior to maturity may be subject to loss. Past performance is no guarantee of future results. All investing involves risk, including the potential loss of principal, and there can be no guarantee that any investing strategy will be successful.
The Dow Jones Industrial Average (DJIA) is a price-weighted index composed of 30 widely traded blue-chip U.S. common stocks. The S&P 500 is a market-cap weighted index composed of the common stocks of 500 largest, publicly traded companies in leading industries of the U.S. economy. The NASDAQ Composite Index is a market-value weighted index of all common stocks listed on the NASDAQ stock exchange. The Russell 2000 is a market-cap weighted index composed of 2,000 U.S. small-cap common stocks. The Global Dow is an equally weighted index of 150 widely traded blue-chip common stocks worldwide. The U.S. Dollar Index is a geometrically weighted index of the value of the U.S. dollar relative to six foreign currencies. Market indexes listed are unmanaged and are not available for direct investment.
Broadridge Investor Communication Solutions, Inc. prepared this material for use by Scarlet Oak Financial Services.
Broadridge Investor Communication Solutions, Inc. does not provide investment, tax, legal, or retirement advice or recommendations. The information presented here is not specific to any individual’s personal circumstances. To the extent that this material concerns tax matters, it is not intended or written to be used, and cannot be used, by a taxpayer for the purpose of avoiding penalties that may be imposed by law. Each taxpayer should seek independent advice from a tax professional based on individual circumstances. Scarlet Oak Financial Services provide these materials for general information and educational purposes based upon publicly available information from sources believed to be reliable — we cannot assure the accuracy or completeness of these materials. The information in these materials may change at any time and without notice.
