
Market Week: November 13, 2023
Weekly Recap:
Stocks had a volatile week anticipating upcoming inflation reports, with tech and growth stocks leading the market. The Nasdaq, S&P 500, and Dow showed gains, while small caps in the Russell 2000 lagged. The week featured mixed daily performances influenced by factors like rebounding Treasury yields, slowing global oil demand, and a six-month low in Chinese exports. The latest report from the Bureau of Economic Analysis reveals a widening goods and services trade deficit in September, reaching $61.5 billion. In the labor market, the week ending November 4 saw 217,000 new claims for unemployment insurance. This week, the focus is on inflation, with the latest data of the Consumer Price Index and Producer Price Index for October being released.
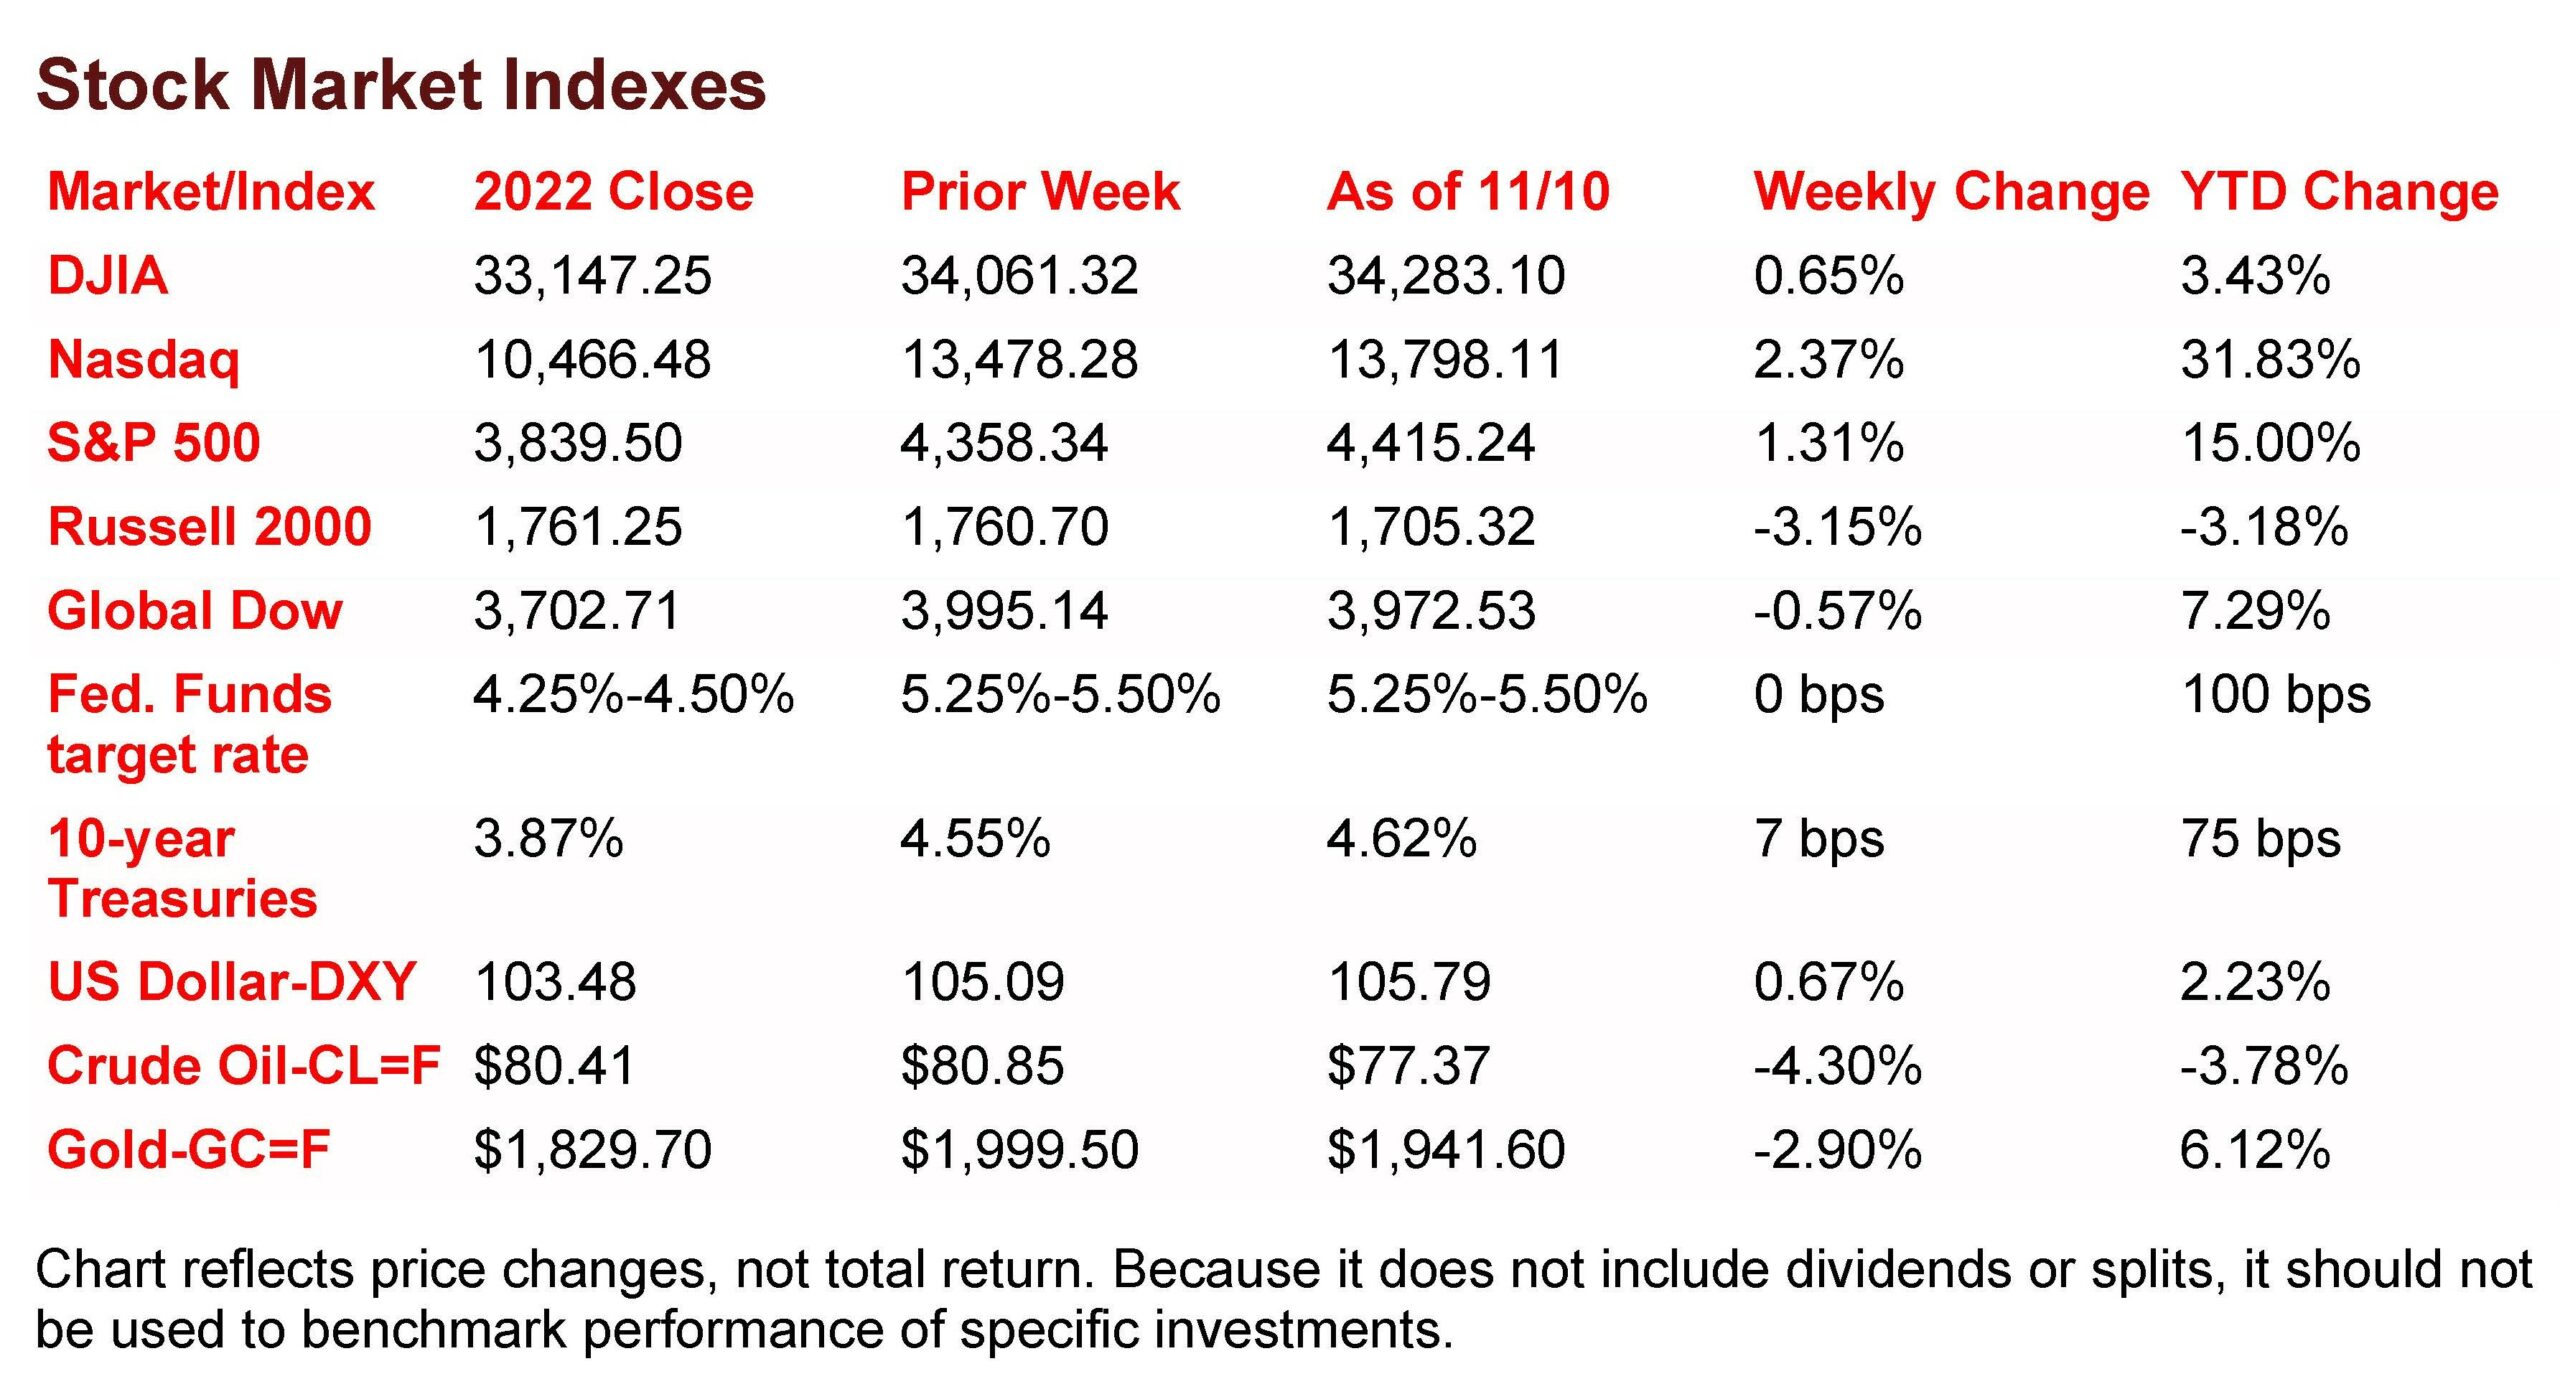
The Markets (as of market close November 10, 2023)
Stocks closed generally higher last week on continued hopes that the Federal Reserve is done raising interest rates despite more hawkish comments from Fed Chair Jerome Powell. Tech and growth stocks carried the market for much of the week as investors looked ahead to this week’s inflation reports. Ten-year Treasury yields eased somewhat from recent 16-year highs. Crude oil prices fell for the third straight week. The dollar edged higher, while gold prices couldn’t maintain momentum, declining nearly 3.0% last week.
Last Monday saw stocks close moderately higher to extend the prior week’s winning streak. Each of the benchmark indexes posted gains, with the exception of the small caps of the Russell 2000, which fell 1.3%. The Nasdaq gained 0.3%, the S&P 500 advanced 0.2%, while the Dow and the Global Dow edged up 0.1%. Stocks began the day on an upswing, only to be dragged lower after a rebound in 10-year Treasury yields, which closed the session at 4.66%, up 10.4 basis points. Crude oil prices (0.5%) and the dollar (0.2%) ended the day up, while gold prices slid 0.7%.
The three major benchmark indexes, the Nasdaq (0.9%), the S&P 500 (0.3%), and the Dow (0.2%), extended their rally last Tuesday, while the Global Dow (-0.5%) and the Russell 2000 (-0.3%) declined. Bond prices advanced with yields on 10-year Treasuries falling 9.1 basis points to 4.57%. Crude oil prices fell 4.2% to $77.45 per barrel, marking the lowest closing price since August. China, the world’s largest consumer of oil, saw it’s exports fall for the sixth straight month in October, highlighting a slowdown in global demand. The dollar inched up 0.3%, while gold prices fell 0.7%.
The Nasdaq and the S&P 500 ticked up 0.1% last Wednesday, barely enough to keep their respective winning streaks alive. The Global Dow fell 0.2%, while the Dow and the Russell 2000 dipped 0.1%. Yields on 10-year Treasuries continued to slide, falling 4.8 basis points to 4.52%. Crude oil prices slumped to $75.46 per barrel, the lowest price since July. The dollar was unchanged, while gold prices declined 0.9%.
Stocks lost value last Thursday, ending the longest winning streak since 2021. Each of the benchmark indexes listed here declined, led by the Russell 2000 (-1.6%), followed by the Nasdaq (-0.9%), the S&P 500 (-0.8%), the Dow (-0.7%), and the Global Dow (-0.4%). Yields for 10-year Treasuries jumped 10.7 basis points to 4.63%. Crude oil prices inched up 0.3%, closing at about $75.54 per barrel. Both the dollar and gold prices edged up 0.3%.
Wall Street saw stocks rebound last Friday, with each of the benchmark indexes closing the session up. The Nasdaq jumped 2.1% as large tech companies pushed that index higher. The S&P 500 hit its highest value since September after gaining 1.6%. The Dow rose 1.2%, the Russell 2000 advanced 1.1%, and the Global Dow gained 0.1%. Among the market sectors, information technology (2.5%), consumer discretionary (1.5%), and communication services (1.4%) performed the best. Ten-year Treasury yields slipped 0.2 basis points, while the dollar and gold prices fell. Crude oil prices rose 2.0%.
Last Week’s Economic News
According to the latest report from the Bureau of Economic Analysis, the goods and services trade deficit for September was $61.5 billion, $2.9 billion, or 4.9%, above the August deficit. September exports were $261.1 billion, $5.7 billion, or 2.2%, more than August exports. September imports were $322.7 billion, $8.6 billion, or 2.7%, more than August imports. Year to date, the goods and services deficit decreased $147.4 billion, or 20.0%, from the same period in 2022. Exports increased $22.7 billion, or 1.0%. Imports decreased $124.8 billion, or 4.2%.
Information on prices for regular gasoline is limited as the U.S. Energy Information Administration delayed its scheduled data releases to complete a planned systems upgrade. It will resume its regular publishing schedule on November 13. In lieu thereof, the national average retail price for regular gasoline was $3.396 per gallon on November 6, $0.077 per gallon lower than the prior week’s price and $0.400 less than a year ago.
For the week ended November 4, there were 217,000 new claims for unemployment insurance, a decrease of 3,000 from the previous week’s level, which was revised up by 3,000. According to the Department of Labor, the advance rate for insured unemployment claims for the week ended October 28 was 1.2%, unchanged from the previous week’s rate. The advance number of those receiving unemployment insurance benefits during the week ended October 28 was 1,834,000, an increase of 22,000 from the previous week’s level, which was revised down by 6,000. States and territories with the highest insured unemployment rates for the week ended October 21 were California (2.0%), Hawaii (2.0%), New Jersey (2.0%), Puerto Rico (1.9%), New York (1.6%), Oregon (1.6%), Alaska (1.5%), Massachusetts (1.5%), Rhode Island (1.5%), and Washington (1.5%). The largest increases in initial claims for unemployment insurance for the week ended October 28 were in Michigan (+2,227), North Carolina (+1,303), California (+842), Minnesota (+767), and Iowa (+613), while the largest decreases were in New York (-1,942), Oregon (-405), Georgia (-348), Florida (-302), and Ohio (-299).
Eye on the Week Ahead
The focus is on inflation this week. The latest data of the Consumer Price Index for October is available. September saw consumer prices increase by 0.4% and 3.7% for the 12 months ended in September. Producer prices also edged higher in September, climbing 0.5%. However, import prices slowed more than anticipated in September after ticking up 0.1%. Conversely, export prices beat expectations, climbing 0.7%.
Key Dates/Data Releases
- 11/14: Consumer Price Index
- 11/15: Producer Price Index, retail sales
- 11/16: Import and export prices, industrial production
- 11/17: Housing starts
Scarlet Oak Financial Services can be reached at 800.871.1219 or contact us here. Click here to sign up for our weekly newsletter with the latest economic news.
Data sources:
Economic: Based on data from U.S. Bureau of Labor Statistics (unemployment, inflation); U.S. Department of Commerce (GDP, corporate profits, retail sales, housing); S&P/Case-Shiller 20-City Composite Index (home prices); Institute for Supply Management (manufacturing/services). Performance: Based on data reported in WSJ Market Data Center (indexes); U.S. Treasury (Treasury yields); U.S. Energy Information Administration/Bloomberg.com Market Data (oil spot price, WTI, Cushing, OK); www.goldprice.org (spot gold/silver); Oanda/FX Street (currency exchange rates).
News items are based on reports from multiple commonly available international news sources (i.e., wire services) and are independently verified when necessary with secondary sources such as government agencies, corporate press releases, or trade organizations. All information is based on sources deemed reliable, but no warranty or guarantee is made as to its accuracy or completeness. Neither the information nor any opinion expressed herein constitutes a solicitation for the purchase or sale of any securities, and should not be relied on as financial advice.
Forecasts are based on current conditions, subject to change, and may not come to pass. U.S. Treasury securities are guaranteed by the federal government as to the timely payment of principal and interest. The principal value of Treasury securities and other bonds fluctuates with market conditions. Bonds are subject to inflation, interest-rate, and credit risks. As interest rates rise, bond prices typically fall. A bond sold or redeemed prior to maturity may be subject to loss. Past performance is no guarantee of future results. All investing involves risk, including the potential loss of principal, and there can be no guarantee that any investing strategy will be successful.
The Dow Jones Industrial Average (DJIA) is a price-weighted index composed of 30 widely traded blue-chip U.S. common stocks. The S&P 500 is a market-cap weighted index composed of the common stocks of 500 largest, publicly traded companies in leading industries of the U.S. economy. The NASDAQ Composite Index is a market-value weighted index of all common stocks listed on the NASDAQ stock exchange. The Russell 2000 is a market-cap weighted index composed of 2,000 U.S. small-cap common stocks. The Global Dow is an equally weighted index of 150 widely traded blue-chip common stocks worldwide. The U.S. Dollar Index is a geometrically weighted index of the value of the U.S. dollar relative to six foreign currencies. Market indexes listed are unmanaged and are not available for direct investment.
Broadridge Investor Communication Solutions, Inc. prepared this material for use by Scarlet Oak Financial Services.
Broadridge Investor Communication Solutions, Inc. does not provide investment, tax, legal, or retirement advice or recommendations. The information presented here is not specific to any individual’s personal circumstances. To the extent that this material concerns tax matters, it is not intended or written to be used, and cannot be used, by a taxpayer for the purpose of avoiding penalties that may be imposed by law. Each taxpayer should seek independent advice from a tax professional based on individual circumstances. Scarlet Oak Financial Services provide these materials for general information and educational purposes based upon publicly available information from sources believed to be reliable — we cannot assure the accuracy or completeness of these materials. The information in these materials may change at any time and without notice.
