
Market Week: August 14, 2023
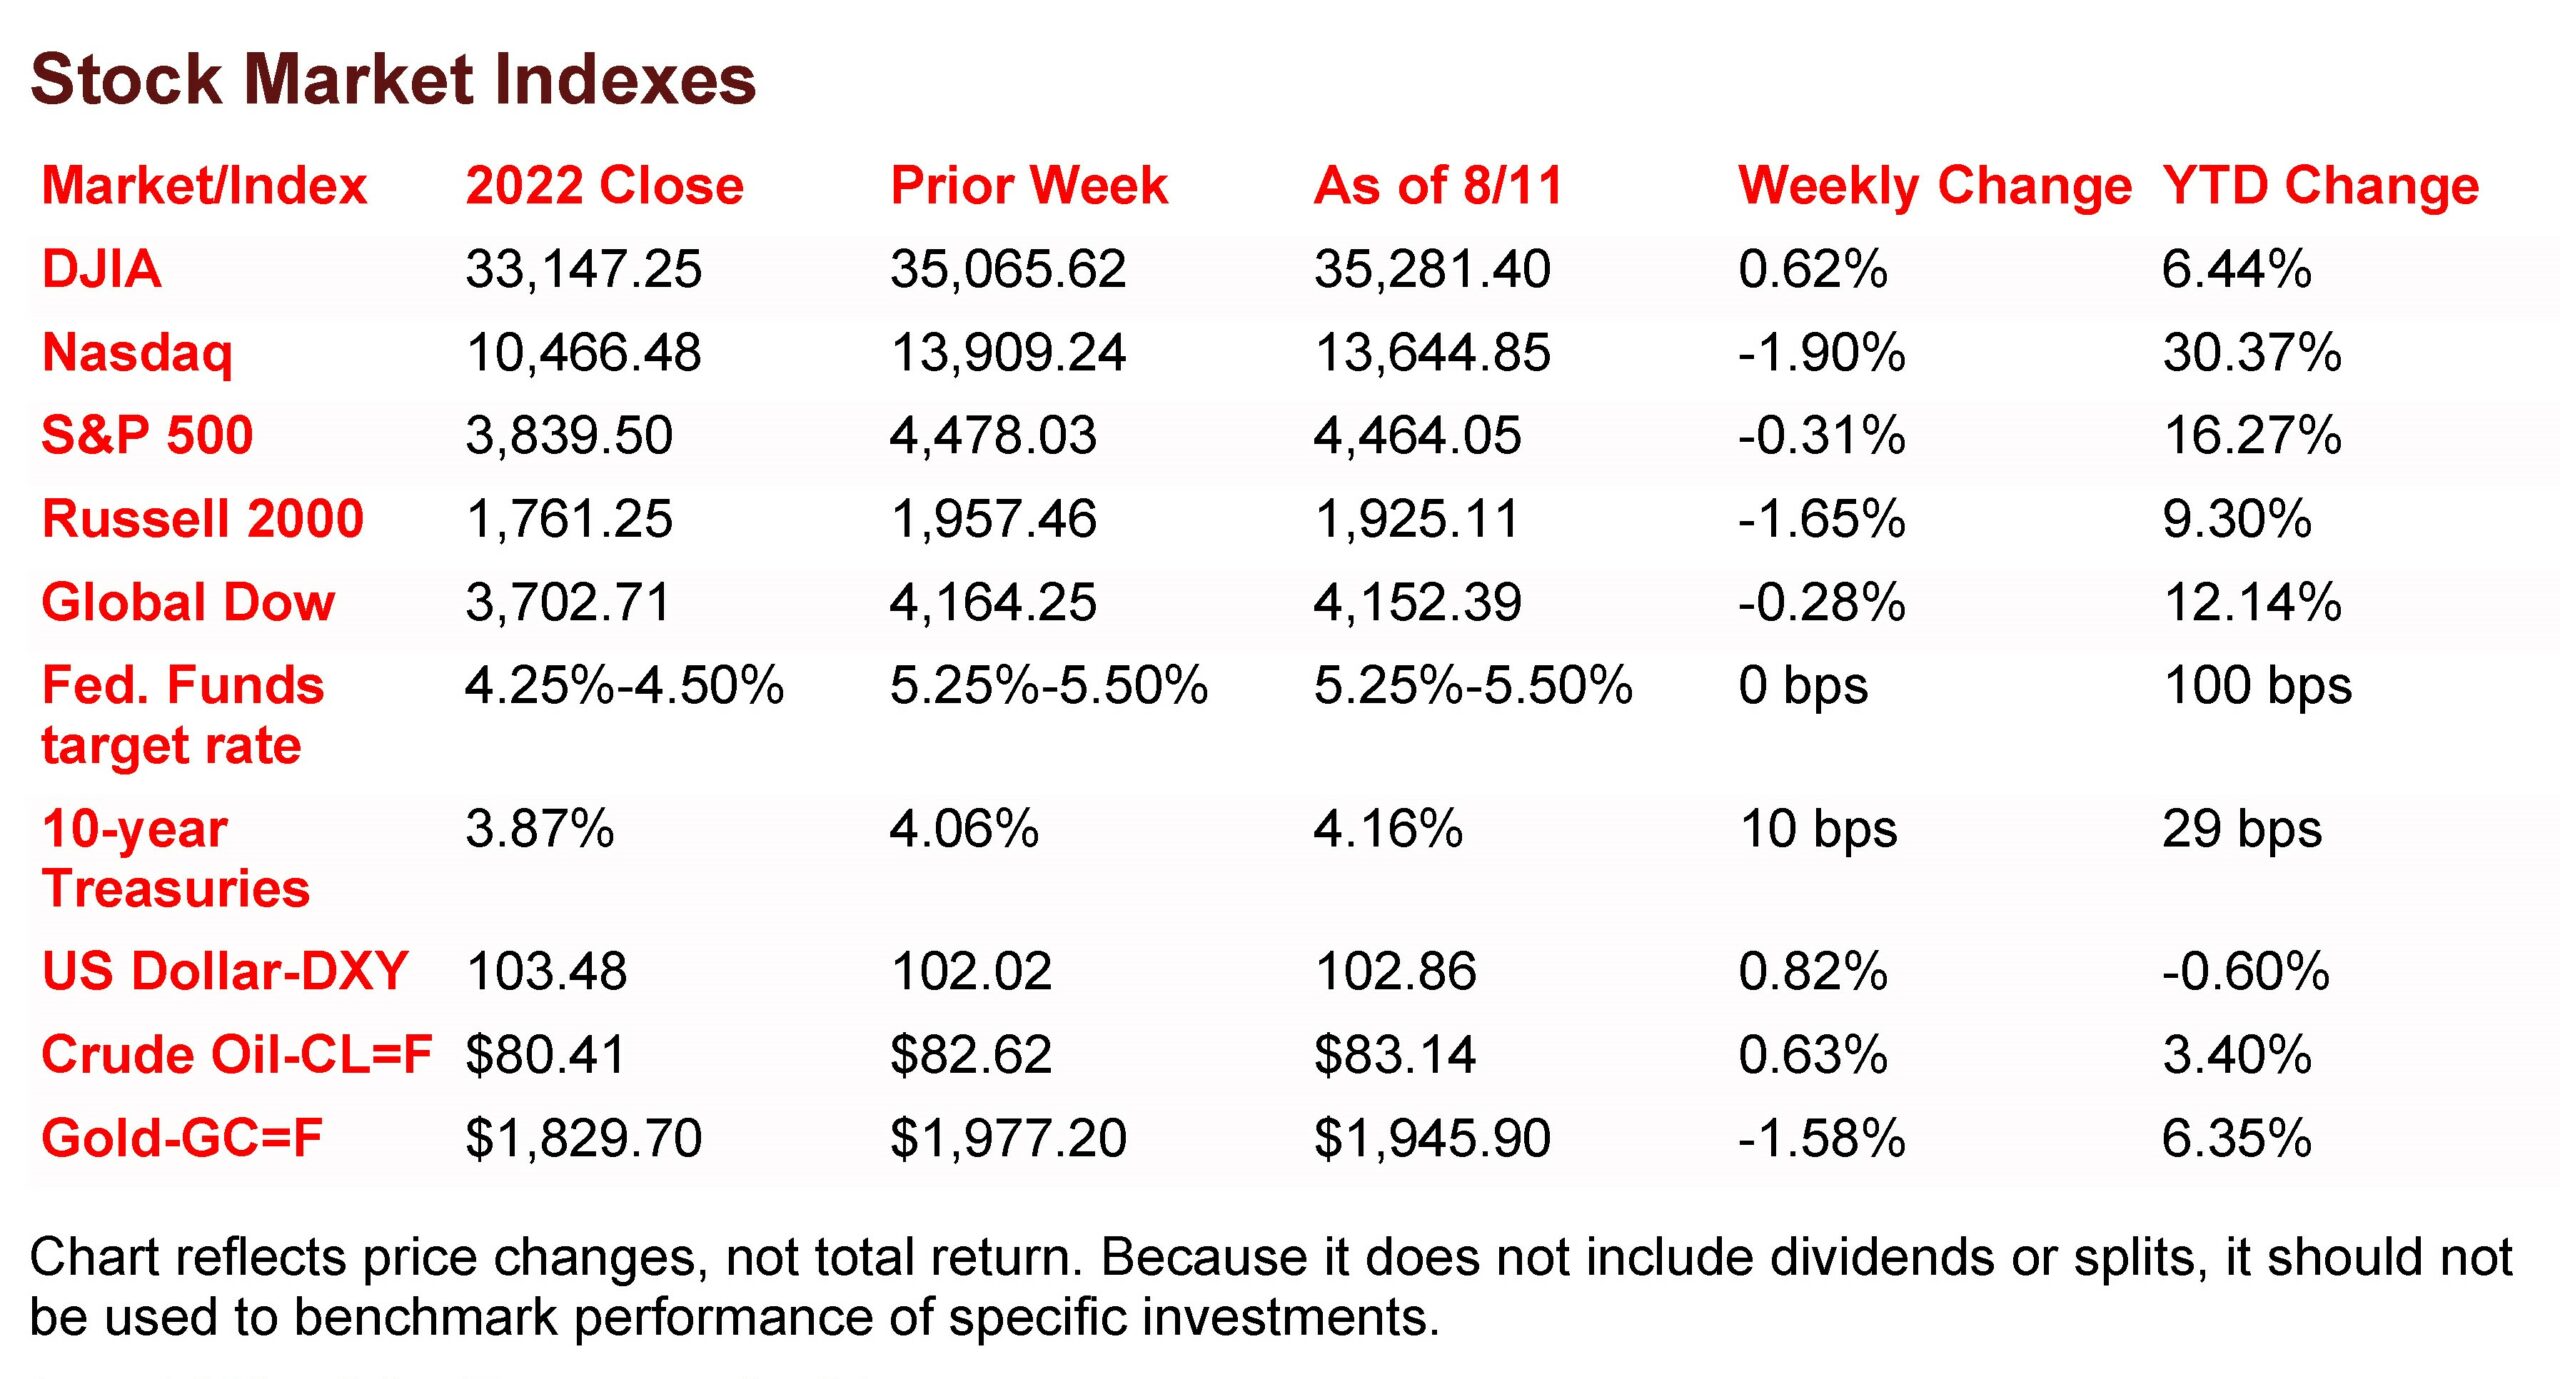
Market Recap: The S&P 500 and Nasdaq fell for the second straight week, with stocks being relatively sluggish in August. Several market sectors ended the week lower, with information technology and consumer discretionary falling the furthest, while energy and health care advanced the most. Corporate earnings season for the second quarter is winding down, with nearly 81% having beaten profit estimates. Stocks jumped higher to begin the week on Monday but declined on Tuesday and Wednesday. Wall Street saw a mini-bear run end on Thursday, with mixed results on Friday. Yields on 10-year Treasuries fluctuated throughout the week.
The Consumer Price Index (CPI) rose 0.2% in July, with food prices up 0.2% and energy prices up 0.1%. The goods and services trade deficit for June was $65.5 billion, down 4.1% from May. The Federal Treasury budget deficit was $220.8 billion in July. The national average retail price for regular gasoline was $3.828 per gallon on August 7. For the week ended August 5, there were 248,000 new claims for unemployment insurance.
The Markets (as of market close August 11, 2023)
The S&P 500 and the Nasdaq fell for the second straight week, while the Dow outperformed the benchmark indexes listed here. Stocks have been relatively soft so far in August, which is not out of the ordinary. A slightly hotter-than-expected uptick in producer prices (see below) likely pushed Treasury yields higher, while cooling mega-cap growth shares, which are generally sensitive to interest rate movements. Several market sectors ended the week lower, with information technology (-4.3%) and consumer discretionary (-2.3%) falling the furthest, while energy (+3.6%) and health care (+2.1%) advanced the most. Corporate earnings season for the second quarter is winding down. With roughly 85% of the S&P 500 companies reporting results, nearly 81% have beaten profit estimates. The dollar strengthened, while gold prices notched the worst weekly performance in over a month.
Stocks jumped higher to begin the week last Monday. Each of the benchmark indexes listed here performed well enough to recoup losses from the previous week. Large caps outperformed, with the Dow gaining 1.2% and the S&P 500 adding 0.9%. The Nasdaq and the Global Dow rose 0.6%, while the Russell 2000 inched up 0.1%. Yields on 10-year Treasuries settled at 4.07%, after climbing 1.8 basis points. Crude oil prices fell 0.4% to end the day at about $82.52 per barrel. The dollar gained less than 0.1%, while gold prices fell 0.3%.
The benchmark indexes listed here declined last Tuesday as Wall Street couldn’t maintain the previous day’s momentum. The Nasdaq dropped 0.8%, followed by the Global Dow (-0.7%), the Russell 2000 (-0.6%), the Dow (-0.5%), and the S&P 500 (-0.4%). Ten-year Treasury yields declined 5.2 basis points, ending the day at 4.02%. Crude oil prices gained over 1.0% to close at about $82.80 per barrel. The dollar gained nearly 0.5%, while gold prices fell by about the same amount.
Stocks slid for the second straight day last Wednesday as investors may have been concerned that the upcoming Consumer Price Index would show prices rose in July. The Nasdaq declined 1.2%, falling the furthest among the benchmark indexes listed here. The Russell 2000 declined 0.9%, followed by the S&P 500 (-0.7%), the Dow (-0.5%), and the Global Dow (-0.1%). Crude oil prices rose 1.7% to $84.30 per barrel, the highest price per barrel in a year. Ten-year Treasury yields dipped 1.4 basis points to settle at 4.01%. The dollar and gold prices declined.
Wall Street saw a mini-bear run end last Thursday. Of the benchmark indexes listed here, only the Russell 2000 fell (-0.4%). While gains were not particularly noteworthy, the remaining indexes closed in the black, led by the Global Dow (0.3%), followed by the Dow (0.2%), and the Nasdaq (0.1%). The S&P 500 gained less than 0.1 percentage point. Investors seemed to react cautiously following the release of the latest Consumer Price Index (see below). Crude oil prices declined 1.8% to $82.86 per barrel after hitting a 12-month high the previous day. Ten-year Treasury yields rose 6.8 basis points to reach 4.08%. The dollar edged higher, while gold prices slid lower.
Stocks ended the week with mixed results last Friday. The Dow (+0.3%) and the Russell 2000 (+0.1%) ticked higher, while the Nasdaq (-0.7%), the Global Dow (-0.6%), and the S&P 500 (-0.1%) declined. Yields on 10-year Treasuries settled at 4.16% after climbing 8.8 basis points. Crude oil prices advanced 0.3%. The dollar had its best day in several sessions, closing up 0.3%. Gold prices fell 0.2%.
Last Week’s Economic News
Consumer prices rose 0.2% in July, the same increase as in June. For the 12 months ended in July, consumer prices have risen 3.2%, after increasing 3.0% for the 12 months ended in June. Consumer prices less food and energy also advanced 0.2%, matching the June increase. Year over year, consumer prices less food and energy dipped 0.1 percentage point to 4.7%. In July, prices for shelter (+0.4%) were by far the largest contributor to the monthly advance, accounting for over 90% of the increase. Food prices increased 0.2% in July after increasing 0.1% the previous month. Prices for energy rose 0.1% last month after rising 0.6% in June. Since July 2022, prices for shelter rose 7.7%, food prices increased 4.9%, while energy prices decreased 12.5%. Other indexes with notable increases over the last 12 months include motor vehicle insurance (+17.8%), recreation (+4.1%), new vehicles (+3.5%), and household furnishings and operations (+2.9%).
Prices producers received for goods and services rose 0.3% in July after being flat in June and declining 0.3% in May. In July, prices for services increased 0.5% (the largest monthly increase since August), while prices for goods inched up 0.1%. Since July 2022, producer prices advanced 0.8%. Prices less foods, energy, and trade services (core prices) moved up 0.2% last month, the largest increase since February. For the 12 months ended in July, core prices advanced 2.7%.
The goods and services trade deficit was $65.5 billion in June, down $2.8 billion, or 4.1%, from May. June exports dipped $0.3 billion, or 0.1%, while imports fell $3.1 billion, or 1.0%. Year to date, the goods and services deficit decreased $117.7 billion, or 22.3%, from the same period in 2022. Exports increased $37.6 billion, or 2.5%. Imports decreased $80.1 billion, or 4.0%.
The Federal Treasury budget deficit was $220.8 billion in July, marginally lower than the June deficit, but about $10.0 billion over the July 2022 deficit. Through 11 months of fiscal year 2023, the deficit sits at $1,613.4 trillion. Over the same period in fiscal year 2022, the deficit was $726.1 billion. In July, total government expenditures exceeded receipts by $220.7 billion.
The national average retail price for regular gasoline was $3.828 per gallon on August 7, $0.071 per gallon higher than the prior week’s price but $0.210 less than a year ago. Also, as of August 7, the East Coast price increased $0.091 to $3.737 per gallon; the Midwest price climbed $0.066 to $3.678 per gallon; the Gulf Coast price rose $0.037 to $3.453 per gallon; the Rocky Mountain price increased $0.071 to $3.944 per gallon; and the West Coast price advanced $0.069 to $4.685 per gallon.
For the week ended August 5, there were 248,000 new claims for unemployment insurance, an increase of 21,000 from the previous week’s level. According to the Department of Labor, the advance rate for insured unemployment claims for the week ended July 29 was 1.1%, unchanged from the previous week’s rate. The advance number of those receiving unemployment insurance benefits during the week ended July 29 was 1,684,000, a decrease of 8,000 from the previous week’s level, which was revised down by 8,000. States and territories with the highest insured unemployment rates for the week ended July 22 were New Jersey (2.6%), California (2.3%), Puerto Rico (2.2%), Rhode Island (2.1%), Massachusetts (2.0%), Connecticut (1.9%), New York (1.8%), Oregon (1.8%), Pennsylvania (1.8%), and Minnesota (1.7%). The largest increases in initial claims for unemployment insurance for the week ended July 29 were in Missouri (+2,644), New Jersey (+730), Illinois (+723), Florida (+533), and Tennessee (+365), while the largest decreases were in California (-3,108), Ohio (-2,952), Georgia (-1,373), Texas (-1,102), and New York (-1,001).
Eye on the Week Ahead
The latest data on retail sales for July is released this week. June saw retail sales inch up 0.2%. Retail sales have increased between 0.1% and 0.4% since May after dropping 0.8% in April. The Federal Reserve’s report on industrial production is also out this week. Industrial production has declined each month since May, when it rose 0.5%.
Key Dates/Data Releases
- 8/15: Retail sales, import and export prices
- 8/16: Industrial production, housing starts
Scarlet Oak Financial Services can be reached at 800.871.1219 or contact us here. Click here to sign up for our weekly newsletter with the latest economic news.
Data sources:
Economic: Based on data from U.S. Bureau of Labor Statistics (unemployment, inflation);
U.S. Department of Commerce (GDP, corporate profits, retail sales, housing); S&P/Case-Shiller 20-City Composite Index (home prices); Institute for Supply Management (manufacturing/services). Performance: Based on data reported in WSJ Market Data Center (indexes); U.S. Treasury (Treasury yields); U.S. Energy Information Administration/Bloomberg.com Market Data (oil spot price, WTI, Cushing, OK); www.goldprice.org (spot gold/silver); Oanda/FX Street (currency exchange rates).
News items are based on reports from multiple commonly available international news sources (i.e., wire services) and are independently verified when necessary with secondary sources such as government agencies, corporate press releases, or trade organizations. All information is based on sources deemed reliable, but no warranty or guarantee is made as to its accuracy or completeness. Neither the information nor any opinion expressed herein constitutes a solicitation for the purchase or sale of any securities, and should not be relied on as financial advice. Forecasts are based on current conditions, subject to change, and may not come to pass. U.S. Treasury securities are guaranteed by the federal government as to the timely payment of principal and interest. The principal value of Treasury securities and other bonds fluctuates with market conditions. Bonds are subject to inflation, interest-rate, and credit risks. As interest rates rise, bond prices typically fall. A bond sold or redeemed prior to maturity may be subject to loss. Past performance is no guarantee of future results. All investing involves risk, including the potential loss of principal, and there can be no guarantee that any investing strategy will be successful.
The Dow Jones Industrial Average (DJIA) is a price-weighted index composed of 30 widely traded blue-chip U.S. common stocks. The S&P 500 is a market-cap weighted index composed of the common stocks of 500 largest, publicly traded companies in leading industries of the U.S. economy. The NASDAQ Composite Index is a market-value weighted index of all common stocks listed on the NASDAQ stock exchange. The Russell 2000 is a market-cap weighted index composed of 2,000 U.S. small-cap common stocks. The Global Dow is an equally weighted index of 150 widely traded blue-chip common stocks worldwide. The U.S. Dollar Index is a geometrically weighted index of the value of the U.S. dollar relative to six foreign currencies. Market indexes listed are unmanaged and are not available for direct investment.
Broadridge Investor Communication Solutions, Inc. prepared this material for use by Scarlet Oak Financial Services.
Broadridge Investor Communication Solutions, Inc. does not provide investment, tax, legal, or retirement advice or recommendations. The information presented here is not specific to any individual’s personal circumstances. To the extent that this material concerns tax matters, it is not intended or written to be used, and cannot be used, by a taxpayer for the purpose of avoiding penalties that may be imposed by law. Each taxpayer should seek independent advice from a tax professional based on individual circumstances. Scarlet Oak Financial Services provide these materials for general information and educational purposes based upon publicly available information from sources believed to be reliable — we cannot assure the accuracy or completeness of these materials. The information in these materials may change at any time and without notice.
