
Market Week: February 13, 2023
The Markets (as of market close February 10, 2023)
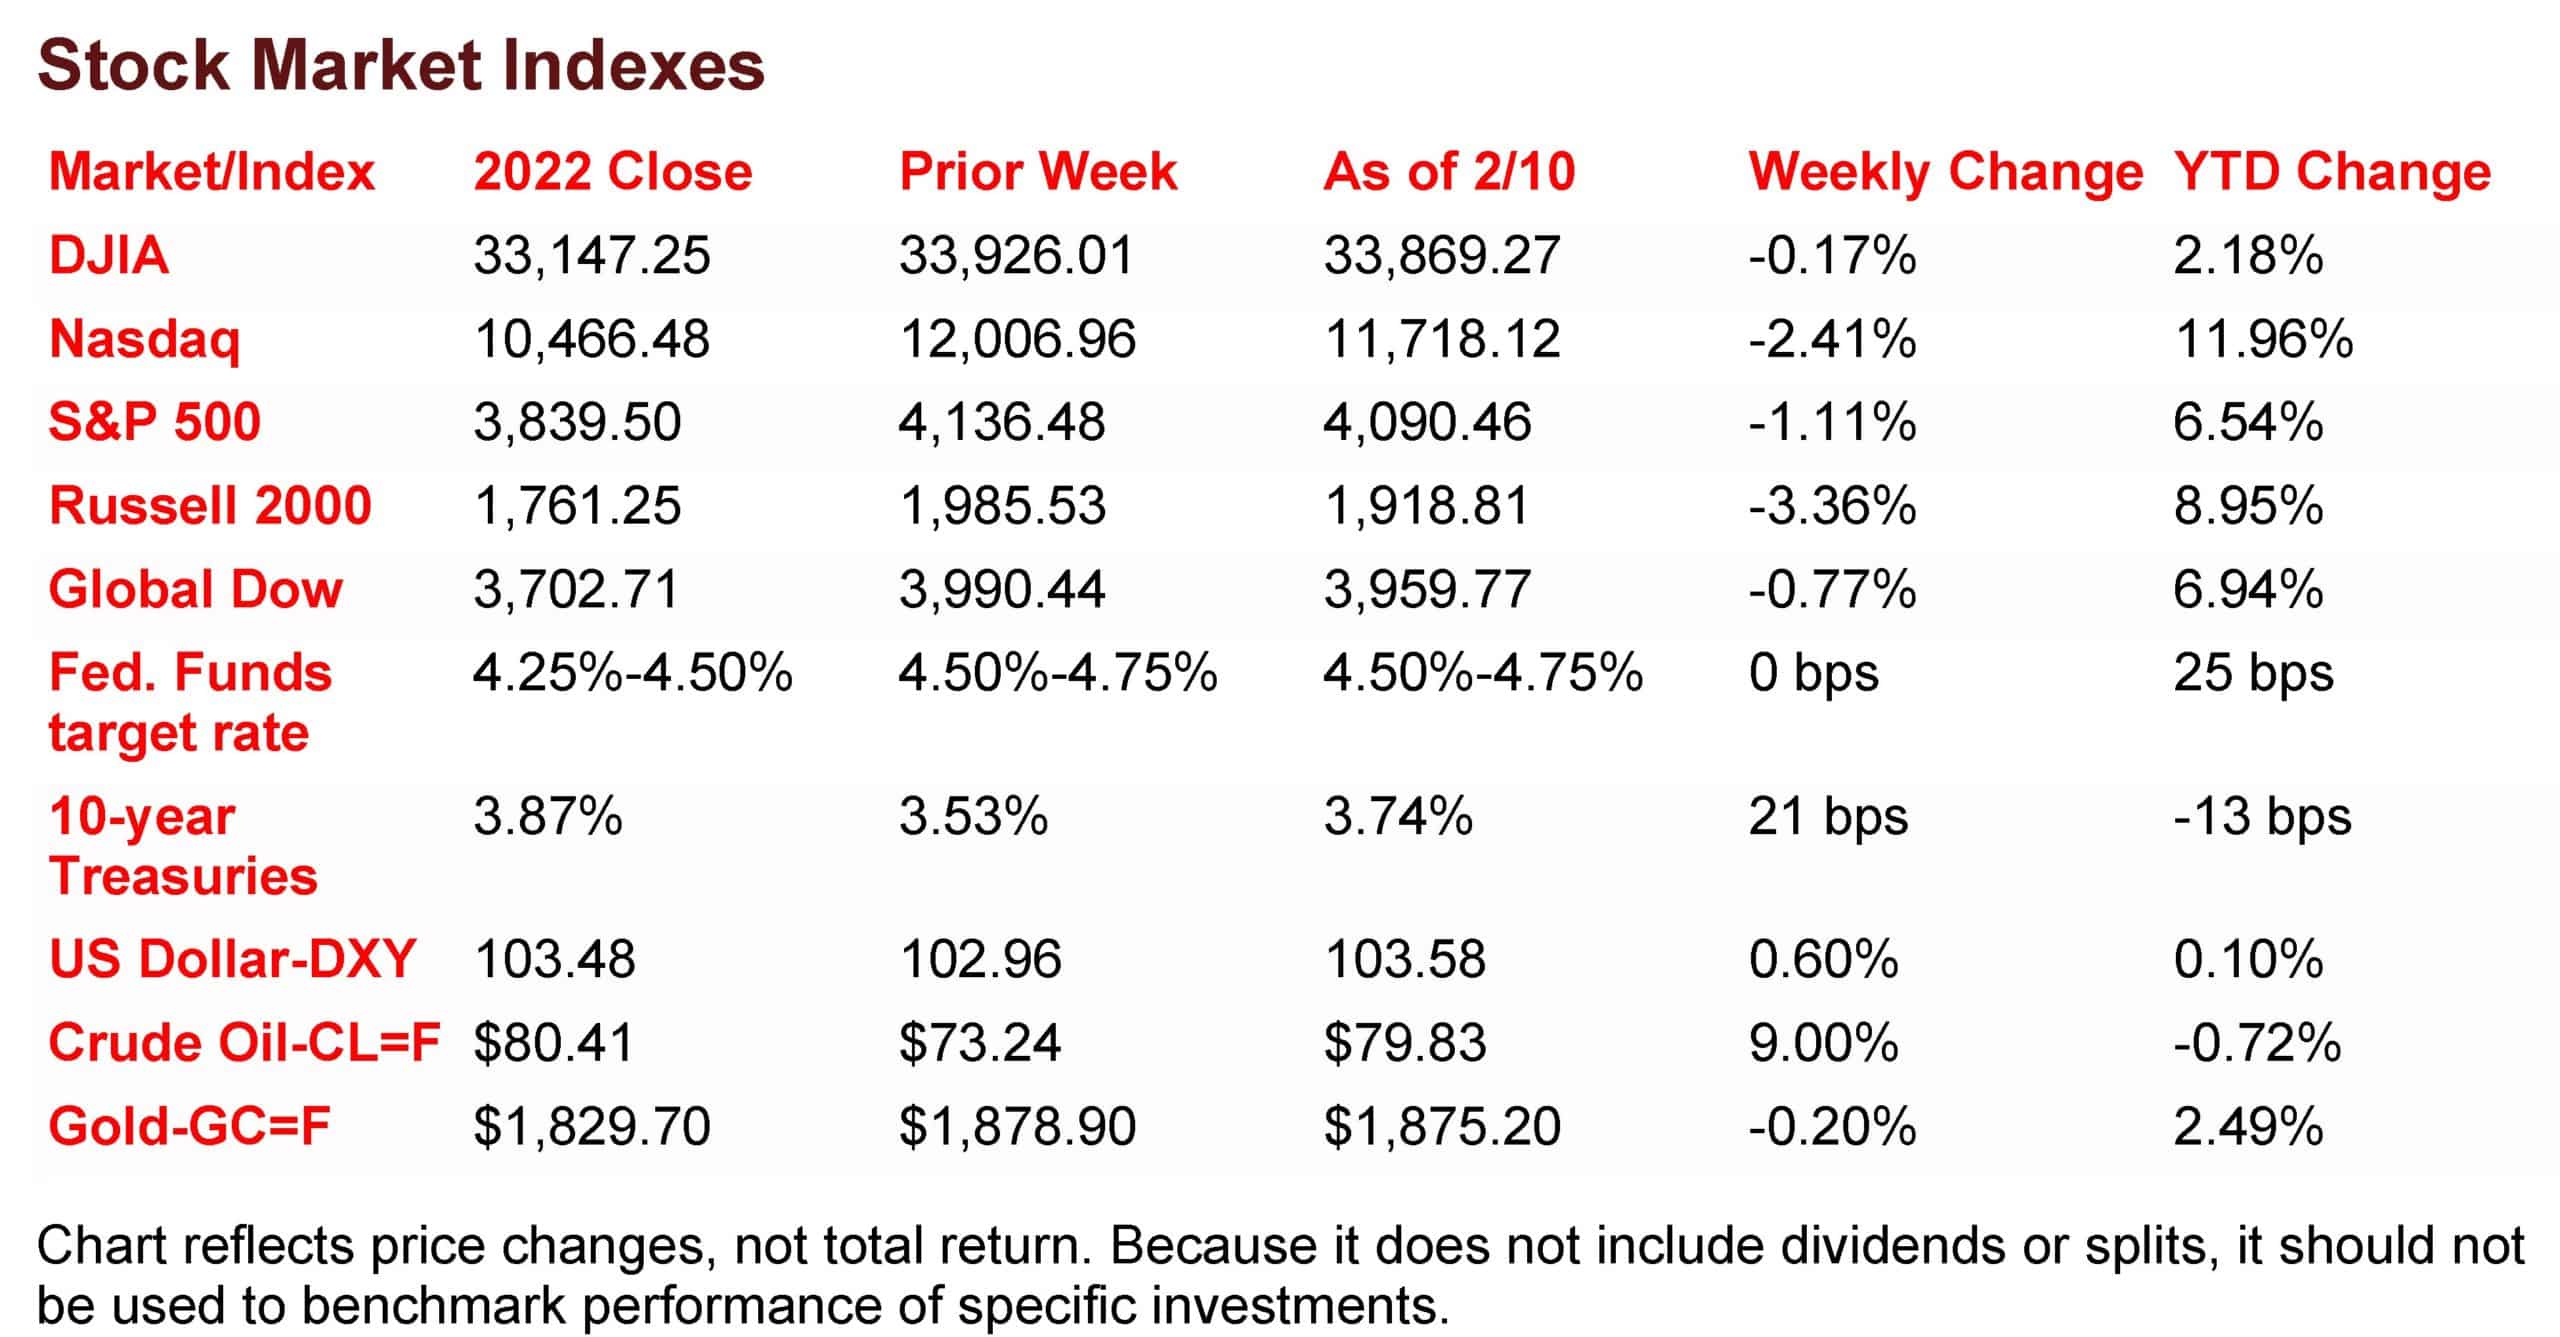
Stocks dipped lower last week as investors mulled the direction of the economy as the Federal Reserve continued to increase interest rates, bolstered by January’s strong labor report. With fourth-quarter corporate earnings reporting season nearing a close, fewer companies are topping profit expectations, which may be another indication of a slowing economy. Each of the benchmark indexes posted weekly losses, with the S&P 500 turning in its worst weekly performance of the year. The yield on 10-year Treasuries rose 21.0 basis points as bond prices declined. Crude oil prices jumped late last week following Russia’s announcement that it plans to cut oil production by about 5.0% next month in retaliation against Western oil sanctions. The dollar inched higher, while gold prices slipped lower.
Stocks opened last week lower as investors awaited the Federal Reserve’s next move. January’s surging jobs report certainly supported the Fed’s aggressive policy to bring down inflation and could lead to a longer period of interest-rate hikes. By the close of trading last Monday, the Russell 2000 (-1.4%), the Global Dow (-1.0%), and the Nasdaq (-1.0%) led the declining benchmark indexes, followed by the S&P 500 (-0.6%) and the Dow (-0.1%). Ten-year Treasury yields shot up 10.2 basis points to 3.63%. Crude oil prices rose for the first time in several sessions, adding $1.07 to reach $74.46 per barrel. The dollar and gold prices also advanced on the day.
Wall Street saw stocks rebound last Tuesday after Federal Reserve Chair Jerome Powell said that the process of getting inflation down (disinflation) had begun, although it has a long way to go. Investors expected the Federal Reserve to take a hawkish stance on the heels of the latest robust jobs report. By the end of the trading session, each of the benchmark indexes posted solid gains, with the Nasdaq reversing course from the previous day after gaining 1.9%. The S&P 500 added 1.3%, followed by the Dow and the Russell 2000 (0.8%) and the Global Dow (0.7%). Bond prices continued to fall, with the yield on 10-year Treasuries adding 4.0 basis points to 3.67%. Crude oil prices increased for the second straight day, climbing to $77.31 per barrel. The dollar slipped lower, while gold prices rose marginally higher.
Stocks were unable to maintain the previous day’s rally, as each of the benchmark indexes listed here lost value last Wednesday. The volatile Nasdaq declined 1.7%, the Russell 2000 dropped 1.5%, the S&P 500 slid 1.1%, the Dow fell 0.6%, and the Global Dow decreased 0.2%. Ten-year Treasury yields closed at 3.65% after falling 2.1 basis points. Crude oil prices continued to rally, increasing 1.6% to reach $78.40 per barrel. The dollar and gold prices advanced.
Last Thursday saw stocks fall for the second straight session amid mixed corporate earnings data. The Russell 2000 (-1.3%) and the Nasdaq (-1.0%) led the declining benchmark indexes, followed by the S&P 500 (-0.9%), the Dow (-0.7%), and the Global Dow (-0.2%). Ten-year Treasury yields added 3.0 basis points to close at 3.68%. Crude oil ended a modest rally, falling 1.1% to $77.62 per barrel. The dollar and gold prices slid lower.
Stocks ended the week mixed last Friday, with the Nasdaq and the Global Dow trending lower, while the Dow, the S&P 500, and the Russell 2000 advanced. Ten-year Treasury yields rose 6.1 basis points to 3.74%. Crude oil prices advanced $1.74 to $79.83 per barrel. the dollar advanced, while gold prices slid lower.
Last Week’s Economic News
The monthly report on the international trade in goods and services deficit, released February 7, is for December and shows that the goods and services trade deficit was $67.4 billion, up $6.4 billion from the November trade deficit. December exports were $250.2 billion, $2.2 billion less than November exports. December imports were $317.6 billion, $4.2 billion more than November imports. For 2022, the goods and services trade deficit increased $103.0 billion, or 12.2%, from 2021. Exports increased $453.1 billion, or 17.7%. Imports increased $556.1 billion, or 16.3%.
The Treasury budget deficit was $38.8 billion in January, down from December’s $85.0 billion, but well above the January 2022 surplus of $118.7 billion. Through the first four months of fiscal year 2023, the deficit sits at $460.2 billion, $201.2 billion higher than the deficit over the same period last fiscal year.
Average regular retail gas prices slid lower last week, according to the U.S. Energy Information Administration. The national average retail price for regular gasoline was $3.444 per gallon on February 6, $0.045 per gallon less than the prior week’s price and unchanged from a year ago. Also, as of February 6, the East Coast price decreased $0.060 to $3.406 per gallon; the Gulf Coast price dipped $0.041 to $3.092 per gallon; the Midwest price fell $0.085 to $3.297 per gallon; the West Coast price increased $0.022 to $4.107 per gallon; and the Rocky Mountain price advanced $0.150 to $3.694 per gallon. Residential heating oil prices averaged $4.465 per gallon on February 6, $0.192 below the previous week’s price but $0.547 per gallon more than a year ago.
For the week ended February 4, there were 196,000 new claims for unemployment insurance, an increase of 13,000 from the previous week’s level. According to the Department of Labor, the advance rate for insured unemployment claims for the week ended January 28 was 1.2%, an increase of 0.1 percentage point from the previous week’s rate. The advance number of those receiving unemployment insurance benefits during the week ended January 28 was 1,688,000, an increase of 38,000 from the previous week’s level, which was revised down by 5,000. States and territories with the highest insured unemployment rates for the week ended January 21 were New Jersey (2.6%), Rhode Island (2.4%), California (2.3%), Alaska (2.2%), Minnesota (2.2%), Massachusetts (2.1%), Puerto Rico (2.0%), Montana (2.0%), Illinois (1.9%), and New York (1.9%). The largest increases in initial claims for unemployment insurance for the week ended January 28 were in Georgia (+2,070), New York (+949), New Jersey (+847), Oregon (+801), and Wisconsin (+569), while the largest decreases were in Kentucky (-3,402), California (-2,551), Ohio (-1,105), Arkansas (-568), and Michigan (-359).
Eye on the Week Ahead
The latest inflation data is available this week with the release of the consumer price index, the producer price index, and the report on import and export prices. Inflationary pressures appear to have peaked. This latest information could show prices beginning to slide, which reinforces the effectiveness of the Fed’s aggressive interest-rate hike policy.
Key Dates/Data Releases
- 2/14: Consumer Price Index
- 2/15: Retail sales, industrial production
- 2/16: Producer Price Index, housing starts
- 2/17: Import and export prices
Visits can be reached at 800.871.1219 or contact us here. Click here to sign up for our weekly newsletter with the latest economic news.
Data sources:
Economic: Based on data from U.S. Bureau of Labor Statistics (unemployment, inflation); U.S. Department of Commerce (GDP, corporate profits, retail sales, housing); S&P/Case-Shiller 20-City Composite Index (home prices); Institute for Supply Management (manufacturing/services). Performance: Based on data reported in WSJ Market Data Center (indexes); U.S. Treasury (Treasury yields); U.S. Energy Information Administration/Bloomberg.com Market Data (oil spot price, WTI, Cushing, OK); www.goldprice.org (spot gold/silver); Oanda/FX Street (currency exchange rates). News items are based on reports from multiple commonly available international news sources (i.e., wire services) and are independently verified when necessary with secondary sources such as government agencies, corporate press releases, or trade organizations. All information is based on sources deemed reliable, but no warranty or guarantee is made as to its accuracy or completeness. Neither the information nor any opinion expressed herein constitutes a solicitation for the purchase or sale of any securities, and should not be relied on as financial advice. Forecasts are based on current conditions, subject to change, and may not come to pass. U.S. Treasury securities are guaranteed by the federal government as to the timely payment of principal and interest. The principal value of Treasury securities and other bonds fluctuates with market conditions. Bonds are subject to inflation, interest-rate, and credit risks. As interest rates rise, bond prices typically fall. A bond sold or redeemed prior to maturity may be subject to loss. Past performance is no guarantee of future results. All investing involves risk, including the potential loss of principal, and there can be no guarantee that any investing strategy will be successful.
The Dow Jones Industrial Average (DJIA) is a price-weighted index composed of 30 widely traded blue-chip U.S. common stocks. The S&P 500 is a market-cap weighted index composed of the common stocks of 500 largest, publicly traded companies in leading industries of the U.S. economy. The NASDAQ Composite Index is a market-value weighted index of all common stocks listed on the NASDAQ stock exchange. The Russell 2000 is a market-cap weighted index composed of 2,000 U.S. small-cap common stocks. The Global Dow is an equally weighted index of 150 widely traded blue-chip common stocks worldwide. The U.S. Dollar Index is a geometrically weighted index of the value of the U.S. dollar relative to six foreign currencies. Market indexes listed are unmanaged and are not available for direct investment.
Broadridge Investor Communication Solutions, Inc. prepared this material for use by Scarlet Oak Financial Services.
Broadridge Investor Communication Solutions, Inc. does not provide investment, tax, legal, or retirement advice or recommendations. The information presented here is not specific to any individual’s personal circumstances. To the extent that this material concerns tax matters, it is not intended or written to be used, and cannot be used, by a taxpayer for the purpose of avoiding penalties that may be imposed by law. Each taxpayer should seek independent advice from a tax professional based on individual circumstances. Scarlet Oak Financial Services provide these materials for general information and educational purposes based upon publicly available information from sources believed to be reliable — we cannot assure the accuracy or completeness of these materials. The information in these materials may change at any time and without notice.
