
Market Week: December 4, 2023
Market Recap:
A solid end to November with a rally, gains in most indexes, higher bond yields, and a decline in crude oil prices despite OPEC+ production cuts. Despite a warning from Federal Reserve Chair Jerome Powell about potential interest rate hikes, the markets thrived. The S&P 500, Dow, and Nasdaq all reached new 2023 highs, extending a five-week streak of gains. Crude oil prices remained subdued due to soft demand, and ten-year Treasury yields experienced a significant monthly decline. Cyber Monday may have contributed to a slight dip in stocks the following Monday, with the Russell 2000 falling the most. The positive trend continued to Friday, closing the week with the fifth consecutive week of higher stock prices, significant gains in the Russell 2000, and a notable drop in bond yields.
Last week’s economic data revealed that the U.S. economy accelerated at an annualized rate of 5.2% in the third quarter, reflecting increases in various sectors, including consumer spending, private inventory investment, and government spending. Manufacturing contracted in November, with the S&P Global U.S. Manufacturing PMI registering 49.4, indicating a decline. The international trade deficit increased, and the national average retail price for regular gasoline declined. On the labor front, there was an increase in new claims for unemployment insurance, reaching the highest level since November 2021. Looking ahead, the focus is on upcoming employment data, including the Job Openings and Labor Turnover Survey for October and the employment situation report for November.
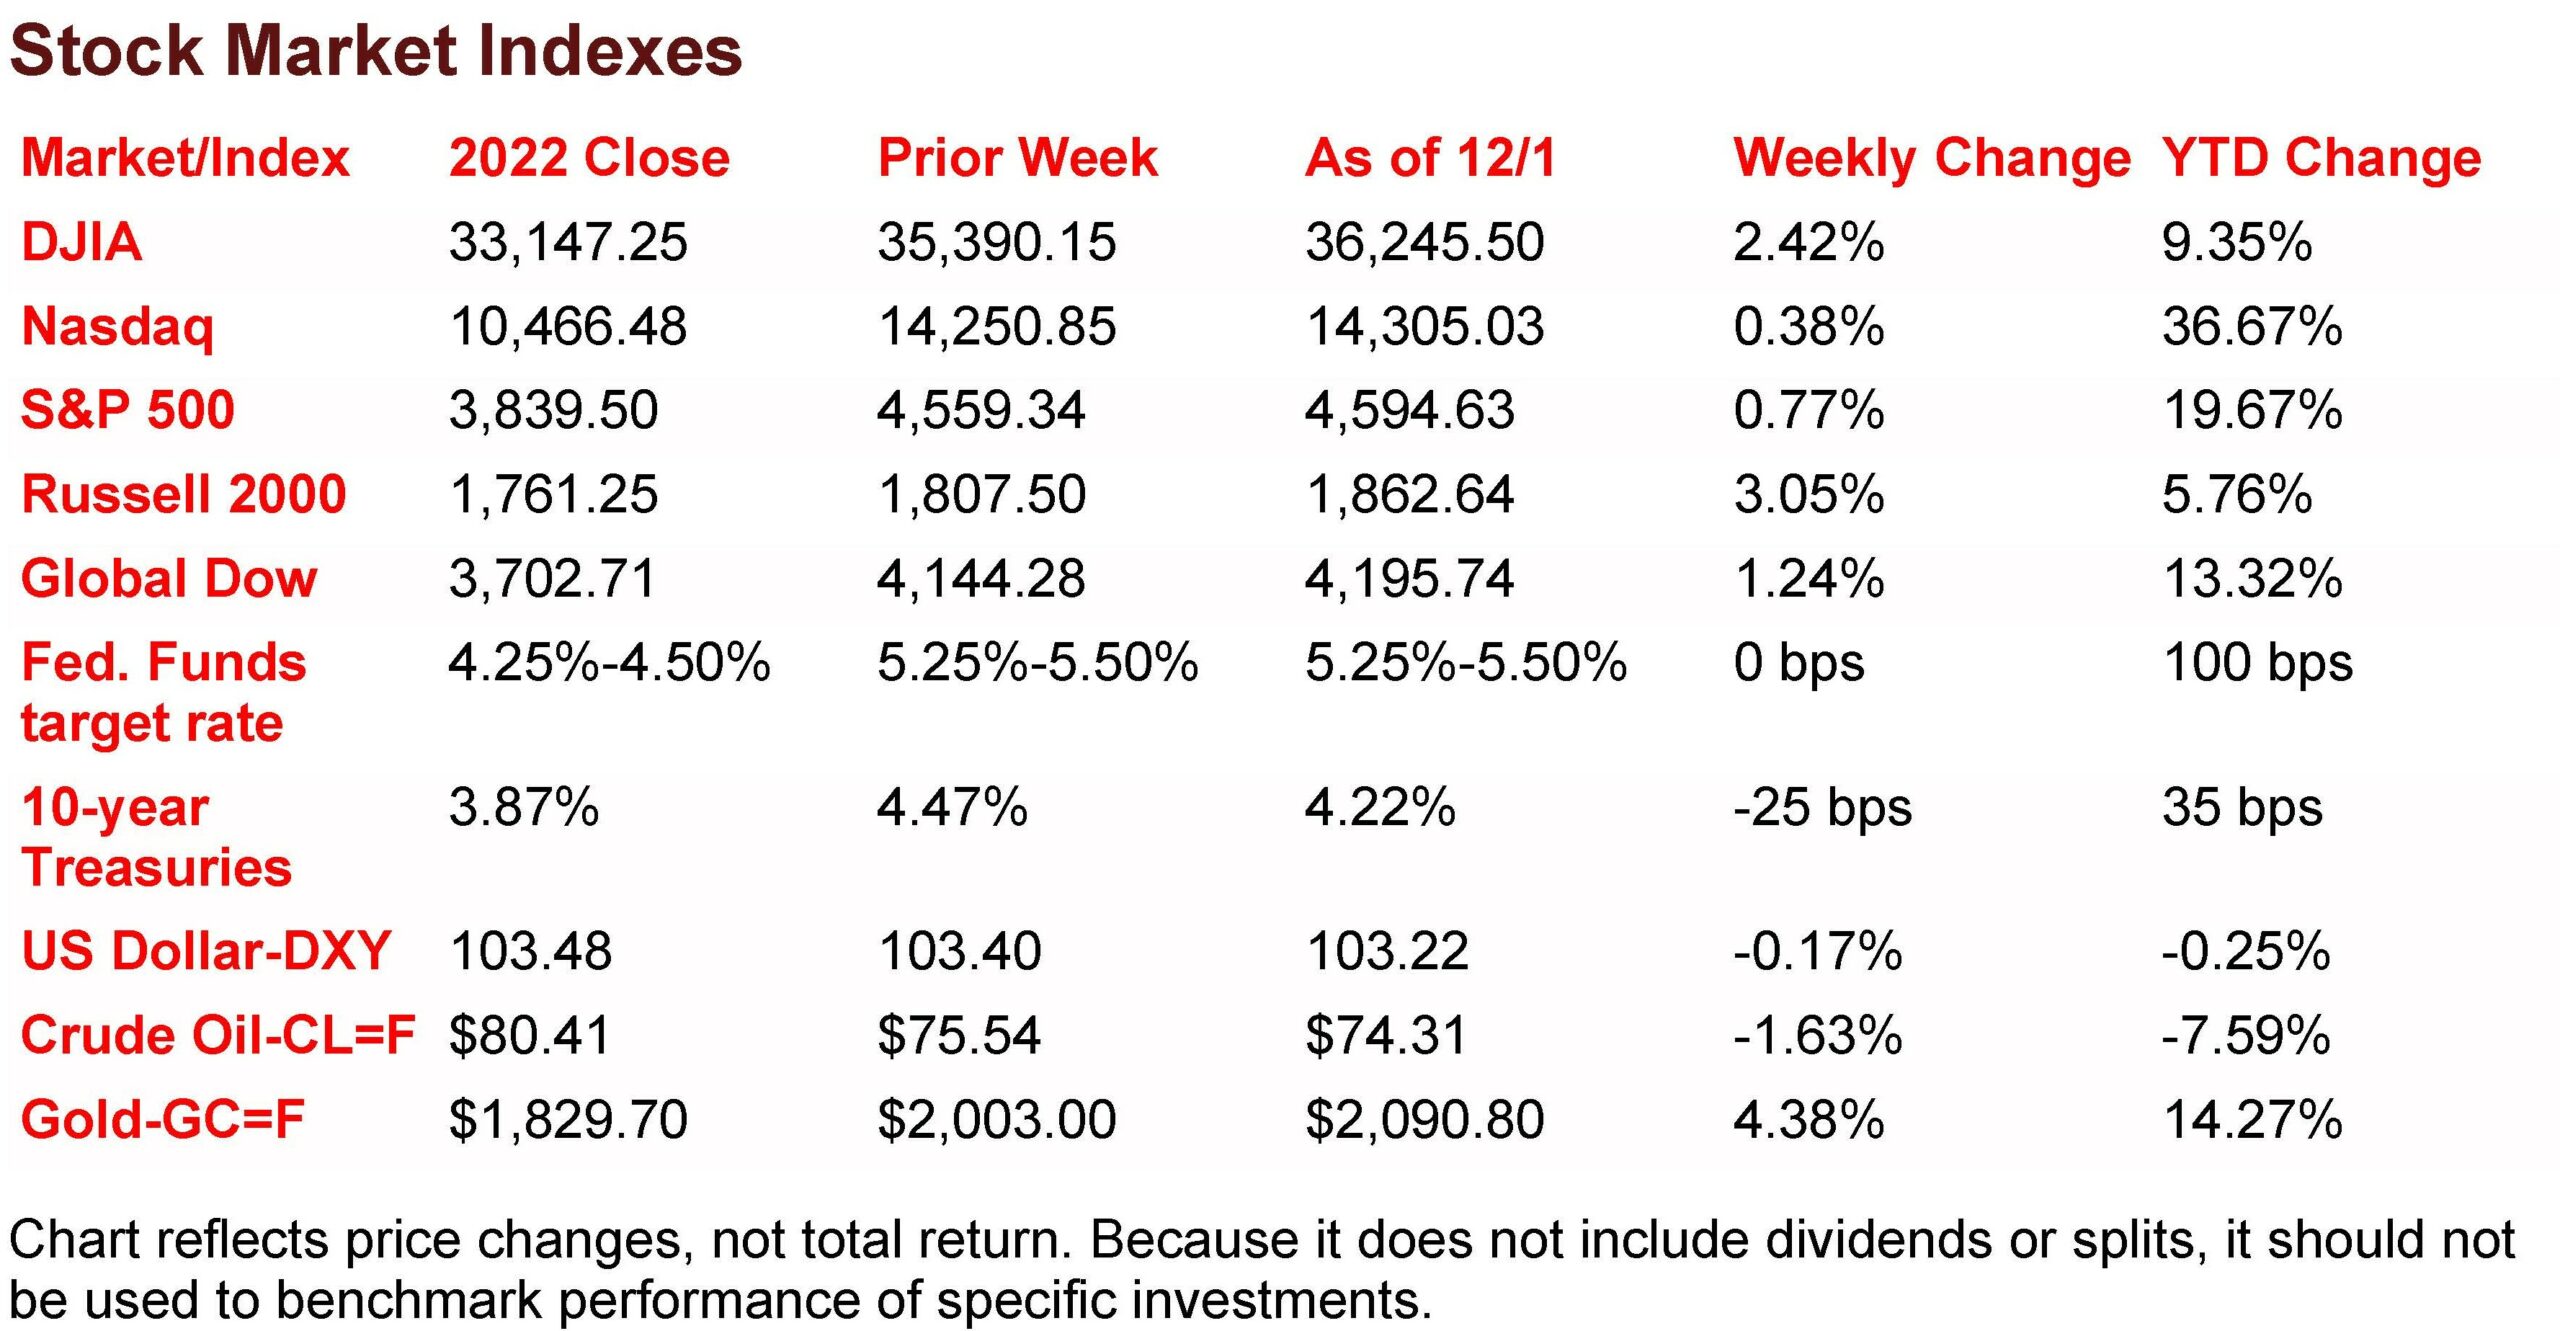
The Markets (as of market close December 1, 2023)
The markets continued to flourish last week. Investors were not deterred by a warning from Federal Reserve Chair Jerome Powell that interest rate hikes may not be over, and it is premature to speculate when rate decreases will begin. The S&P 500 and the Dow reached new 2023 highs, while the Nasdaq posted solid returns as all three indexes extended a run of five straight weekly gains. Despite additional output cuts by OPEC+, crude oil prices continued to lag as demand remained soft. Ten-year Treasury yields closed down nearly 80.0 basis points from a peak in October. Yields fell over 50.0 basis points in November, marking the largest monthly decline since August 2019. The dollar weakened, while gold prices finished the week at a record high.
Stocks edged lower last Monday as investors may have spent more time focused on Cyber Monday deals rather than stock market bargains. Each of the benchmark indexes listed here slipped marginally lower, with the Russell 2000 (-0.3%) falling the furthest, followed by the Global Dow and the S&P 500 (-0.2%), while the Dow (-0.2%) and the Nasdaq (-0.1%) also ticked lower. Long-term bond prices rose, pulling yields on 10-year Treasuries down 8.3 basis points to 4.38%. Crude oil prices dipped 0.7%, settling at around $75.00 per barrel. The dollar declined 0.2%, while gold prices rose 0.6%.
Last Tuesday saw stocks recoup losses from the prior day, while bond yields continued to decline. Among the benchmark indexes listed here, only the Russell 2000 closed in the red, falling 0.5%. The Global Dow advanced 0.4%, the Nasdaq rose 0.3%, the Dow climbed 0.2%, and the S&P 500 inched up 0.1%. Ten-year Treasury yields settled at 4.33% after falling 5.3 basis points. Crude oil prices rose 2.0% to $76.37 per barrel. The dollar fell 0.4%, while gold prices gained 1.5%, advancing for the second straight day.
Stocks closed mostly lower last Wednesday. Among the benchmark indexes listed here, only the Russell 2000 (0.6%) advanced, with the Dow and the Global Dow unchanged. The Nasdaq and the S&P 500 dipped 0.1%. Stocks began the day on an upswing as investor hopes for a strengthening economy got a boost by solid third-quarter gross domestic product data (see below). By the close of trading, most of the morning’s gains were lost. Bonds continued to rally as yields on 10-year Treasuries lost 6.5 basis points to settle at 4.27%. Crude oil prices advanced for the second straight day, climbing 1.7% to $77.70 per barrel. The dollar and gold prices advanced.
Wall Street posted solid gains last Thursday to close out a strong November. Among the benchmark indexes listed here, only the Nasdaq ended the session in the red, down 0.2%. The remaining indexes added value, led by the Dow (1.5%), followed by the S&P 500 and the Global Dow (0.4%), while the Russell 2000 edged up 0.3%. Bond prices, which had been surging, slid lower, driving yields higher. Ten-year Treasury yields closed at 4.35% after adding 8.1 basis points. Crude oil prices fell 2.8% to $75.67 per barrel despite an announced cut in production by OPEC+. The dollar gained 0.7%, while gold prices fell 0.5%.
Stocks closed last Friday on an upswing, closing higher for the fifth straight week. The Russell 2000 enjoyed the best returns after gaining 2.8%, followed by the large caps of the Dow, which added 0.8%, the Global Dow rose 0.7%, while the Nasdaq and the S&P 500 gained 0.6%. Bond prices surged with yields on 10-year Treasuries falling 12.6 basis points to 4.22%. Crude oil prices declined 2.3%, the dollar fell 0.3%, while gold prices rose 1.6%.
Last Week’s Economic News
The economy accelerated at an annualized rate of 5.2% in the third quarter, according to the second estimate of gross domestic product. GDP rose 2.1% in the second quarter. The increase in GDP reflected increases in consumer spending, private inventory investment, exports, state and local government spending, federal government spending, residential fixed investment, and nonresidential fixed investment. Imports, which are a negative in the calculation of GDP, increased. The personal consumption expenditures price index increased 2.8%. Excluding food and energy prices, the PCE price index increased 2.3%. Personal consumption expenditures, a major component in the calculation of GDP, rose 3.6% in the third quarter, compared to a 0.8% increase in the second quarter.
The personal consumption expenditures price index, the Federal Reserve’s preferred measure of inflation, increased less than 0.1% in October. Excluding food and energy, the PCE price index rose 0.2%. For the 12 months ended in October, the PCE price index rose 3.0%, 0.4 percentage point lower than the 12-month period ended in September. The PCE price index excluding, food and energy, increased 3.5% since October 2022, down from 3.7% for the 12 months ended in September. Personal income increased 0.2% in October. Disposable (after-tax) personal income increased 0.3%. Personal consumption expenditures, a measure of consumer spending, increased 0.2% in October.
Sales of new single-family homes fell by 5.6% in October but were 17.7% above the October 2022 estimate. The median sales price of new houses sold in October 2023 was $409,300. The average sales price was $487,000. Inventory of new single-family homes for sale was at a 7.8-month supply at the current sales pace.
A decline in new orders dragged manufacturing lower in November, according to the latest S&P Global US Manufacturing PMI. Purchasing managers noted that a drop in new sales led to a slower expansion in production, which led to a reduction in the labor force. The S&P US Manufacturing Purchasing Managers’ Index registered 49.4 in November, down from 50.0 in October. A reading of less than 50.0 indicates contraction in manufacturing.
The advance report on international trade in goods showed a trade deficit of $89.8 billion in October, an increase of 3.4% over the September deficit. Exports of goods for October were $170.8 billion, a decrease of 1.7% from the previous month. Imports of goods for October were $260.7 billion, virtually unchanged from the September estimate.
The national average retail price for regular gasoline was $3.238 per gallon on November 27, $0.051 per gallon lower than the prior week’s price and $0.296 less than a year ago. Also, as of November 27, the East Coast price decreased $0.011 to $3.155 per gallon; the Midwest price fell $0.093 to $3.031 per gallon; the Gulf Coast price declined $0.076 to $2.710 per gallon; the Rocky Mountain price dropped $0.091 to $3.106 per gallon; and the West Coast price decreased $0.054 to $4.363 per gallon.
For the week ended November 25, there were 218,000 new claims for unemployment insurance, an increase of 7,000 from the previous week’s level, which was revised up by 2,000. According to the Department of Labor, the advance rate for insured unemployment claims for the week ended November 18 was 1.3%, an increase of 0.1 percentage point from the previous week’s rate. The advance number of those receiving unemployment insurance benefits during the week ended November 18 was 1,927,000, an increase of 86,000 from the previous week’s level, which was revised up by 1,000. This is the highest level for insured unemployment since November 27, 2021, when it was 1,964,000. States and territories with the highest insured unemployment rates for the week ended November 11 were New Jersey (2.2%), California (2.1%), Alaska (2.0%), Hawaii (1.9%), Puerto Rico (1.7%), Washington (1.7%), Massachusetts (1.6%), New York (1.6%), Oregon (1.6%), and Rhode Island (1.6%). The largest increases in initial claims for unemployment insurance for the week ended November 18 were in California (+7,351), Oregon (+3,461), Kentucky (+1,925), Illinois (+1,359), and Iowa (+1,182), while the largest decreases were in Texas (-896), New York (-616), North Carolina (-537), Utah (-487), and Indiana (-447).
Eye on the Week Ahead
Economic data released during the first full week of December focuses on employment. The latest Job Openings and Labor Turnover Survey is for October. The previous report estimated 9.6 million job openings available in September, relatively unchanged from the prior month’s total. This week, focus will also be aimed at the latest employment situation report for November. Employment has showed signs of slowing, with an estimate of 150,000 new jobs added in October, well below the downwardly revised September total of 297,000.
Key Dates/Data Releases
- 12/4: S&P Global Services PMI
- 12/5: JOLTS
- 12/6: International trade in goods and services
- 12/8: Employment situation
Scarlet Oak Financial Services can be reached at 800.871.1219 or contact us here. Click here to sign up for our weekly newsletter with the latest economic news.
Data sources:
Economic: Based on data from U.S. Bureau of Labor Statistics (unemployment, inflation); U.S. Department of Commerce (GDP, corporate profits, retail sales, housing); S&P/Case-Shiller 20-City Composite Index (home prices); Institute for Supply Management (manufacturing/services). Performance: Based on data reported in WSJ Market Data Center (indexes); U.S. Treasury (Treasury yields); U.S. Energy Information Administration/Bloomberg.com Market Data (oil spot price, WTI, Cushing, OK); www.goldprice.org (spot gold/silver); Oanda/FX Street (currency exchange rates).
News items are based on reports from multiple commonly available international news sources (i.e., wire services) and are independently verified when necessary with secondary sources such as government agencies, corporate press releases, or trade organizations. All information is based on sources deemed reliable, but no warranty or guarantee is made as to its accuracy or completeness. Neither the information nor any opinion expressed herein constitutes a solicitation for the purchase or sale of any securities, and should not be relied on as financial advice.
Forecasts are based on current conditions, subject to change, and may not come to pass. U.S. Treasury securities are guaranteed by the federal government as to the timely payment of principal and interest. The principal value of Treasury securities and other bonds fluctuates with market conditions. Bonds are subject to inflation, interest-rate, and credit risks. As interest rates rise, bond prices typically fall. A bond sold or redeemed prior to maturity may be subject to loss. Past performance is no guarantee of future results. All investing involves risk, including the potential loss of principal, and there can be no guarantee that any investing strategy will be successful.
The Dow Jones Industrial Average (DJIA) is a price-weighted index composed of 30 widely traded blue-chip U.S. common stocks. The S&P 500 is a market-cap weighted index composed of the common stocks of 500 largest, publicly traded companies in leading industries of the U.S. economy. The NASDAQ Composite Index is a market-value weighted index of all common stocks listed on the NASDAQ stock exchange. The Russell 2000 is a market-cap weighted index composed of 2,000 U.S. small-cap common stocks. The Global Dow is an equally weighted index of 150 widely traded blue-chip common stocks worldwide. The U.S. Dollar Index is a geometrically weighted index of the value of the U.S. dollar relative to six foreign currencies. Market indexes listed are unmanaged and are not available for direct investment.
Broadridge Investor Communication Solutions, Inc. prepared this material for use by Scarlet Oak Financial Services.
Broadridge Investor Communication Solutions, Inc. does not provide investment, tax, legal, or retirement advice or recommendations. The information presented here is not specific to any individual’s personal circumstances. To the extent that this material concerns tax matters, it is not intended or written to be used, and cannot be used, by a taxpayer for the purpose of avoiding penalties that may be imposed by law. Each taxpayer should seek independent advice from a tax professional based on individual circumstances. Scarlet Oak Financial Services provide these materials for general information and educational purposes based upon publicly available information from sources believed to be reliable — we cannot assure the accuracy or completeness of these materials. The information in these materials may change at any time and without notice.
