
Market Week: June 12, 2023
Last Week’s Recap:
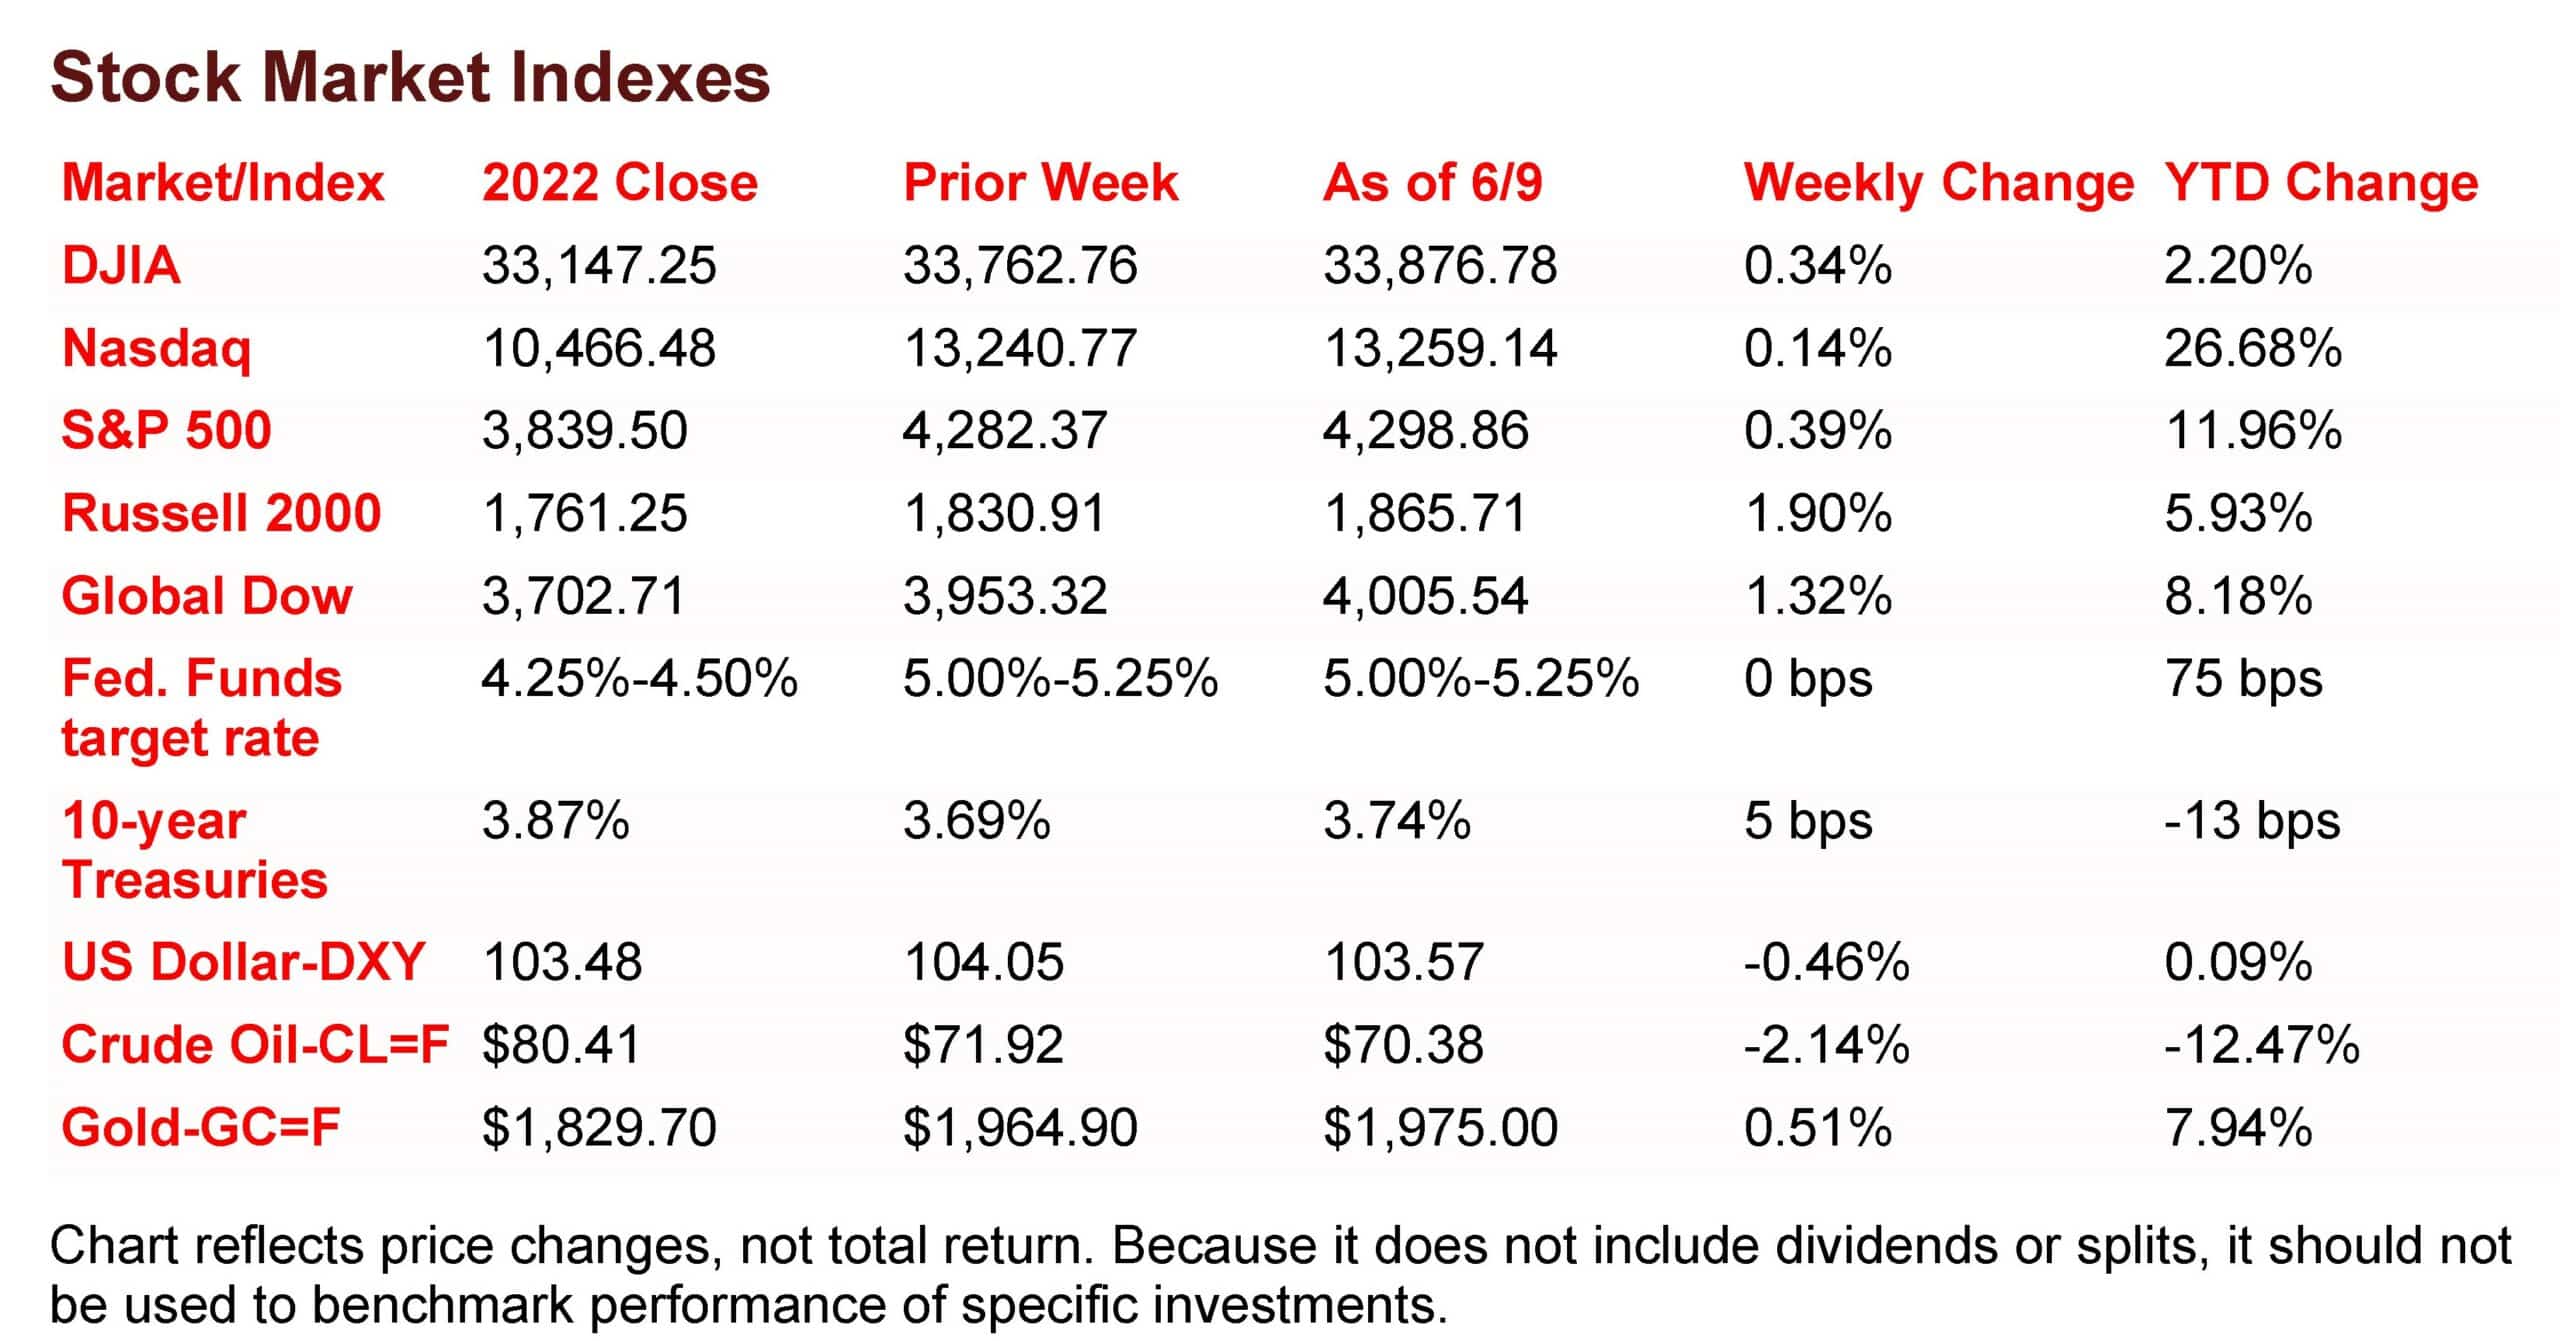
Stocks continue to rise, with each of the benchmark indexes posting gains, with Nasdaq rising for seven consecutive weeks. The S&P 500 is in bull territory, more than 20% above its October 2022 low.
May saw increased business activity in the services sector and new orders in both domestic and export markets, leading to hiring activity. In April, the goods and services trade deficit increased, but the year-to-date deficit decreased by 23.9% from the same period in 2022. The national average retail price for regular gasoline decreased, and new claims for unemployment insurance increased.
The Markets (as of market close June 9, 2023)
Stocks closed another week higher, with each of the benchmark indexes listed here posting gains. With last week’s advance, the Nasdaq has risen for seven consecutive weeks, while the S&P 500 hit its highest level since August 2022. The S&P 500 is more than 20% above its October 2022 low, putting it in bull territory. The Russell 2000 led the indexes, despite falling at the end of last week. The Global Dow also gained more than 1.0%. Long-term bond prices held steady, with yields on 10-year Treasuries inching up 5.0 basis points on the week. Crude oil prices fell for the second consecutive week. The dollar dipped lower, while gold prices edged higher.
Stocks ended last Monday lower, as late-day selling wiped out gains from earlier in the day. The small caps of the Russell 2000 took the biggest hit among the benchmark indexes listed here, falling 1.3%. The Dow lost 0.6%, the S&P 500 slipped 0.2%, while the Global Dow and the Nasdaq dipped less than 0.1%. The dollar and yields on 10-year Treasuries were flat, while gold prices edged higher. Crude oil prices barely moved, closing at $71.80 per barrel, even after Saudi Arabia indicated it would cut oil output by 1 million barrels per day starting in July. The remaining OPEC+ countries agreed to hold to their current oil production through the remainder of the year.
Wall Street rebounded last Tuesday, with several sectors performing well including financials and consumer discretionary. The Russell 2000 more than recouped its losses from the previous day, climbing 2.7%. The Global Dow and the Nasdaq rose 0.4%, followed by the S&P 500 (0.2%). The Dow ended the session flat. Yields on 10-year Treasuries remained at 3.69% for the third straight session. Crude oil prices fell nearly 1.0% to close at around $71.52 per barrel. The dollar and gold prices advanced.
Stocks closed with mixed results last Wednesday. A downturn in mega-cap tech stocks pulled the Nasdaq (-1.30%) and the S&P 500 (-0.4%) lower. The Russell 2000 jumped 1.8%, the Dow added 0.3%, while the Global Dow eked out a 0.1% gain. Bond prices slid, driving yields higher, with 10-year Treasury yields gaining 8.5 basis points to close at 3.78%. The Bank of Canada hiked interest rates in a somewhat unexpected move, which may have led some investors to believe the Fed is not done with its rate increases. Crude oil prices rose 1.1% to hit $72.52 per barrel. The dollar was flat, while gold prices slumped 1.3% to $1,956.20 per ounce.
Last Thursday saw mega caps recover much of Wednesday’s losses, helping to lift the benchmark indexes higher. The Nasdaq added 1.0%, followed by the S&P 500 (0.6%), with the Dow and the Global Dow gaining 0.5%. The small caps of the Russell 2000 edged lower, falling 0.4%. Ten-year Treasury yields dipped 7.0 basis points to close at 3.71%. Crude oil prices continued to ride an ebb and flow, following last Wednesday’s gains by falling 0.6% to $70.89 per barrel. The dollar and gold prices were flat.
Stocks ended last week on a high note (expect for small-cap stocks). While last Friday’s gains enjoyed by most of the benchmark indexes listed here weren’t particularly notable, each index added between 0.1%-0.2% by the close of trading. Only the small-cap heavy Russell 2000 closed the session in the red, falling 0.8%. Ten-year Treasury yields settled at 3.74%, up about 3.1 basis points from the previous day’s close. Crude oil prices fell 1.3% to $70.38 per barrel. The dollar advanced, while gold prices slid marginally.
 Last Week’s Economic News
In May, business activity in the services sector expanded at the fastest pace since April 2022, according to the S&P Global US Services PMI™. Increased demand drove new orders in both the domestic and export markets, which drove firms to increase their hiring activity. Survey respondents noted that greater client confidence supported the expansion in new orders, as customers, especially in consumer markets, were more inclined to spend.
In April, the goods and services trade deficit increased by $14.0 billion to $74.6 billion. Exports fell $9.2 billion, while imports increased $4.8 billion. Year to date, the goods and services deficit decreased $86.5 billion, or 23.9%, from the same period in 2022. Exports increased $55.9 billion, or 5.8%. Imports decreased $30.6 billion, or 2.3%.
The national average retail price for regular gasoline was $3.541 per gallon on June 5, $0.030 per gallon lower than the prior week’s price and $1.335 less than a year ago. Also, as of June 5, the East Coast price decreased $0.017 to $3.410 per gallon; the Midwest price declined $0.054 to $3.430 per gallon; the Gulf Coast price fell $0.056 to $3.065 per gallon; the Rocky Mountain price advanced $0.032 to $3.654 per gallon; and the West Coast price decreased $0.011 to $4.523 per gallon.
For the week ended June 3, there were 261,000 new claims for unemployment insurance, an increase of 28,000 from the previous week’s level, which was revised up by 1,000. This is the highest level for initial claims since October 30, 2021, when it was 264,000. According to the Department of Labor, the advance rate for insured unemployment claims for the week ended May 27 was 1.2%, unchanged from the previous week’s rate. The advance number of those receiving unemployment insurance benefits during the week ended May 27 was 1,757,000, a decrease of 37,000 from the previous week’s level, which was revised down by 1,000. States and territories with the highest insured unemployment rates for the week ended May 20 were California (2.2%), New Jersey (2.1%), Massachusetts (1.8%), New York (1.6%), Oregon (1.6%), Puerto Rico (1.5%), Rhode Island (1.5%), Washington (1.5%), Alaska (1.4%), and Illinois (1.4%). The largest increases in initial claims for unemployment insurance for the week ended May 27 were in Ohio (+2,159), Texas (+1,229), New York (+1,177), Illinois (+1,117), and Missouri (+962), while the largest decreases were in California (-771), Arkansas (-455), Iowa (-419), North Carolina (-388), and Michigan (-365).
Eye on the Week Ahead
The Federal Open Market Committee meets this week. Many speculate that the Committee will not raise interest rates at this time. However, it is unlikely that the abatement of interest rate increases will last past the July meeting.
Key Dates/Data Releases
- 6/12: Treasury statement
- 6/13: Consumer Price Index
- 6/14: FOMC statement
- 6/15: Retail sales, import and export prices, industrial production
Scarlet Oak Financial Services can be reached at 800.871.1219 or contact us here. Click here to sign up for our weekly newsletter with the latest economic news.
Data sources:
Data sources: Economic: Based on data from U.S. Bureau of Labor Statistics (unemployment, inflation);
U.S. Department of Commerce (GDP, corporate profits, retail sales, housing); S&P/Case-Shiller 20-City Composite Index (home prices); Institute for Supply Management (manufacturing/services). Performance: Based on data reported in WSJ Market Data Center (indexes); U.S. Treasury (Treasury yields); U.S. Energy Information Administration/Bloomberg.com Market Data (oil spot price, WTI, Cushing, OK); www.goldprice.org (spot gold/silver); Oanda/FX Street (currency exchange rates).
News items are based on reports from multiple commonly available international news sources (i.e., wire services) and are independently verified when necessary with secondary sources such as government agencies, corporate press releases, or trade organizations. All information is based on sources deemed reliable, but no warranty or guarantee is made as to its accuracy or completeness. Neither the information nor any opinion expressed herein constitutes a solicitation for the purchase or sale of any securities, and should not be relied on as financial advice. Forecasts are based on current conditions, subject to change, and may not come to pass. U.S. Treasury securities are guaranteed by the federal government as to the timely payment of principal and interest. The principal value of Treasury securities and other bonds fluctuates with market conditions. Bonds are subject to inflation, interest-rate, and credit risks. As interest rates rise, bond prices typically fall. A bond sold or redeemed prior to maturity may be subject to loss. Past performance is no guarantee of future results. All investing involves risk, including the potential loss of principal, and there can be no guarantee that any investing strategy will be successful.
The Dow Jones Industrial Average (DJIA) is a price-weighted index composed of 30 widely traded blue-chip U.S. common stocks. The S&P 500 is a market-cap weighted index composed of the common stocks of 500 largest, publicly traded companies in leading industries of the U.S. economy. The NASDAQ Composite Index is a market-value weighted index of all common stocks listed on the NASDAQ stock exchange. The Russell 2000 is a market-cap weighted index composed of 2,000 U.S. small-cap common stocks. The Global Dow is an equally weighted index of 150 widely traded blue-chip common stocks worldwide. The U.S. Dollar Index is a geometrically weighted index of the value of the U.S. dollar relative to six foreign currencies. Market indexes listed are unmanaged and are not available for direct investment.
Broadridge Investor Communication Solutions, Inc. prepared this material for use by Scarlet Oak Financial Services.
Broadridge Investor Communication Solutions, Inc. does not provide investment, tax, legal, or retirement advice or recommendations. The information presented here is not specific to any individual’s personal circumstances. To the extent that this material concerns tax matters, it is not intended or written to be used, and cannot be used, by a taxpayer for the purpose of avoiding penalties that may be imposed by law. Each taxpayer should seek independent advice from a tax professional based on individual circumstances. Scarlet Oak Financial Services provide these materials for general information and educational purposes based upon publicly available information from sources believed to be reliable — we cannot assure the accuracy or completeness of these materials. The information in these materials may change at any time and without notice.
