
Market Week: August 7, 2023
Market Recap:
The stock market experienced a decline due to Fitch’s downgrade of the US government’s credit rating, with the Nasdaq having its worst day in nearly five months. Bond prices fell, but crude oil prices increased for the sixth straight week. In July, the US economy added 187,000 new jobs, with health care, social assistance, financial activities, and wholesale trade gains. The unemployment rate decreased to 3.5%, while the labor force participation rate and the employment-population ratio remained virtually unchanged. Manufacturing continued to decline while the services sector expanded but at a slower pace. July inflation data is expected to show prices rising 0.2%, with inflationary pressures waning and the economy showing resilience.
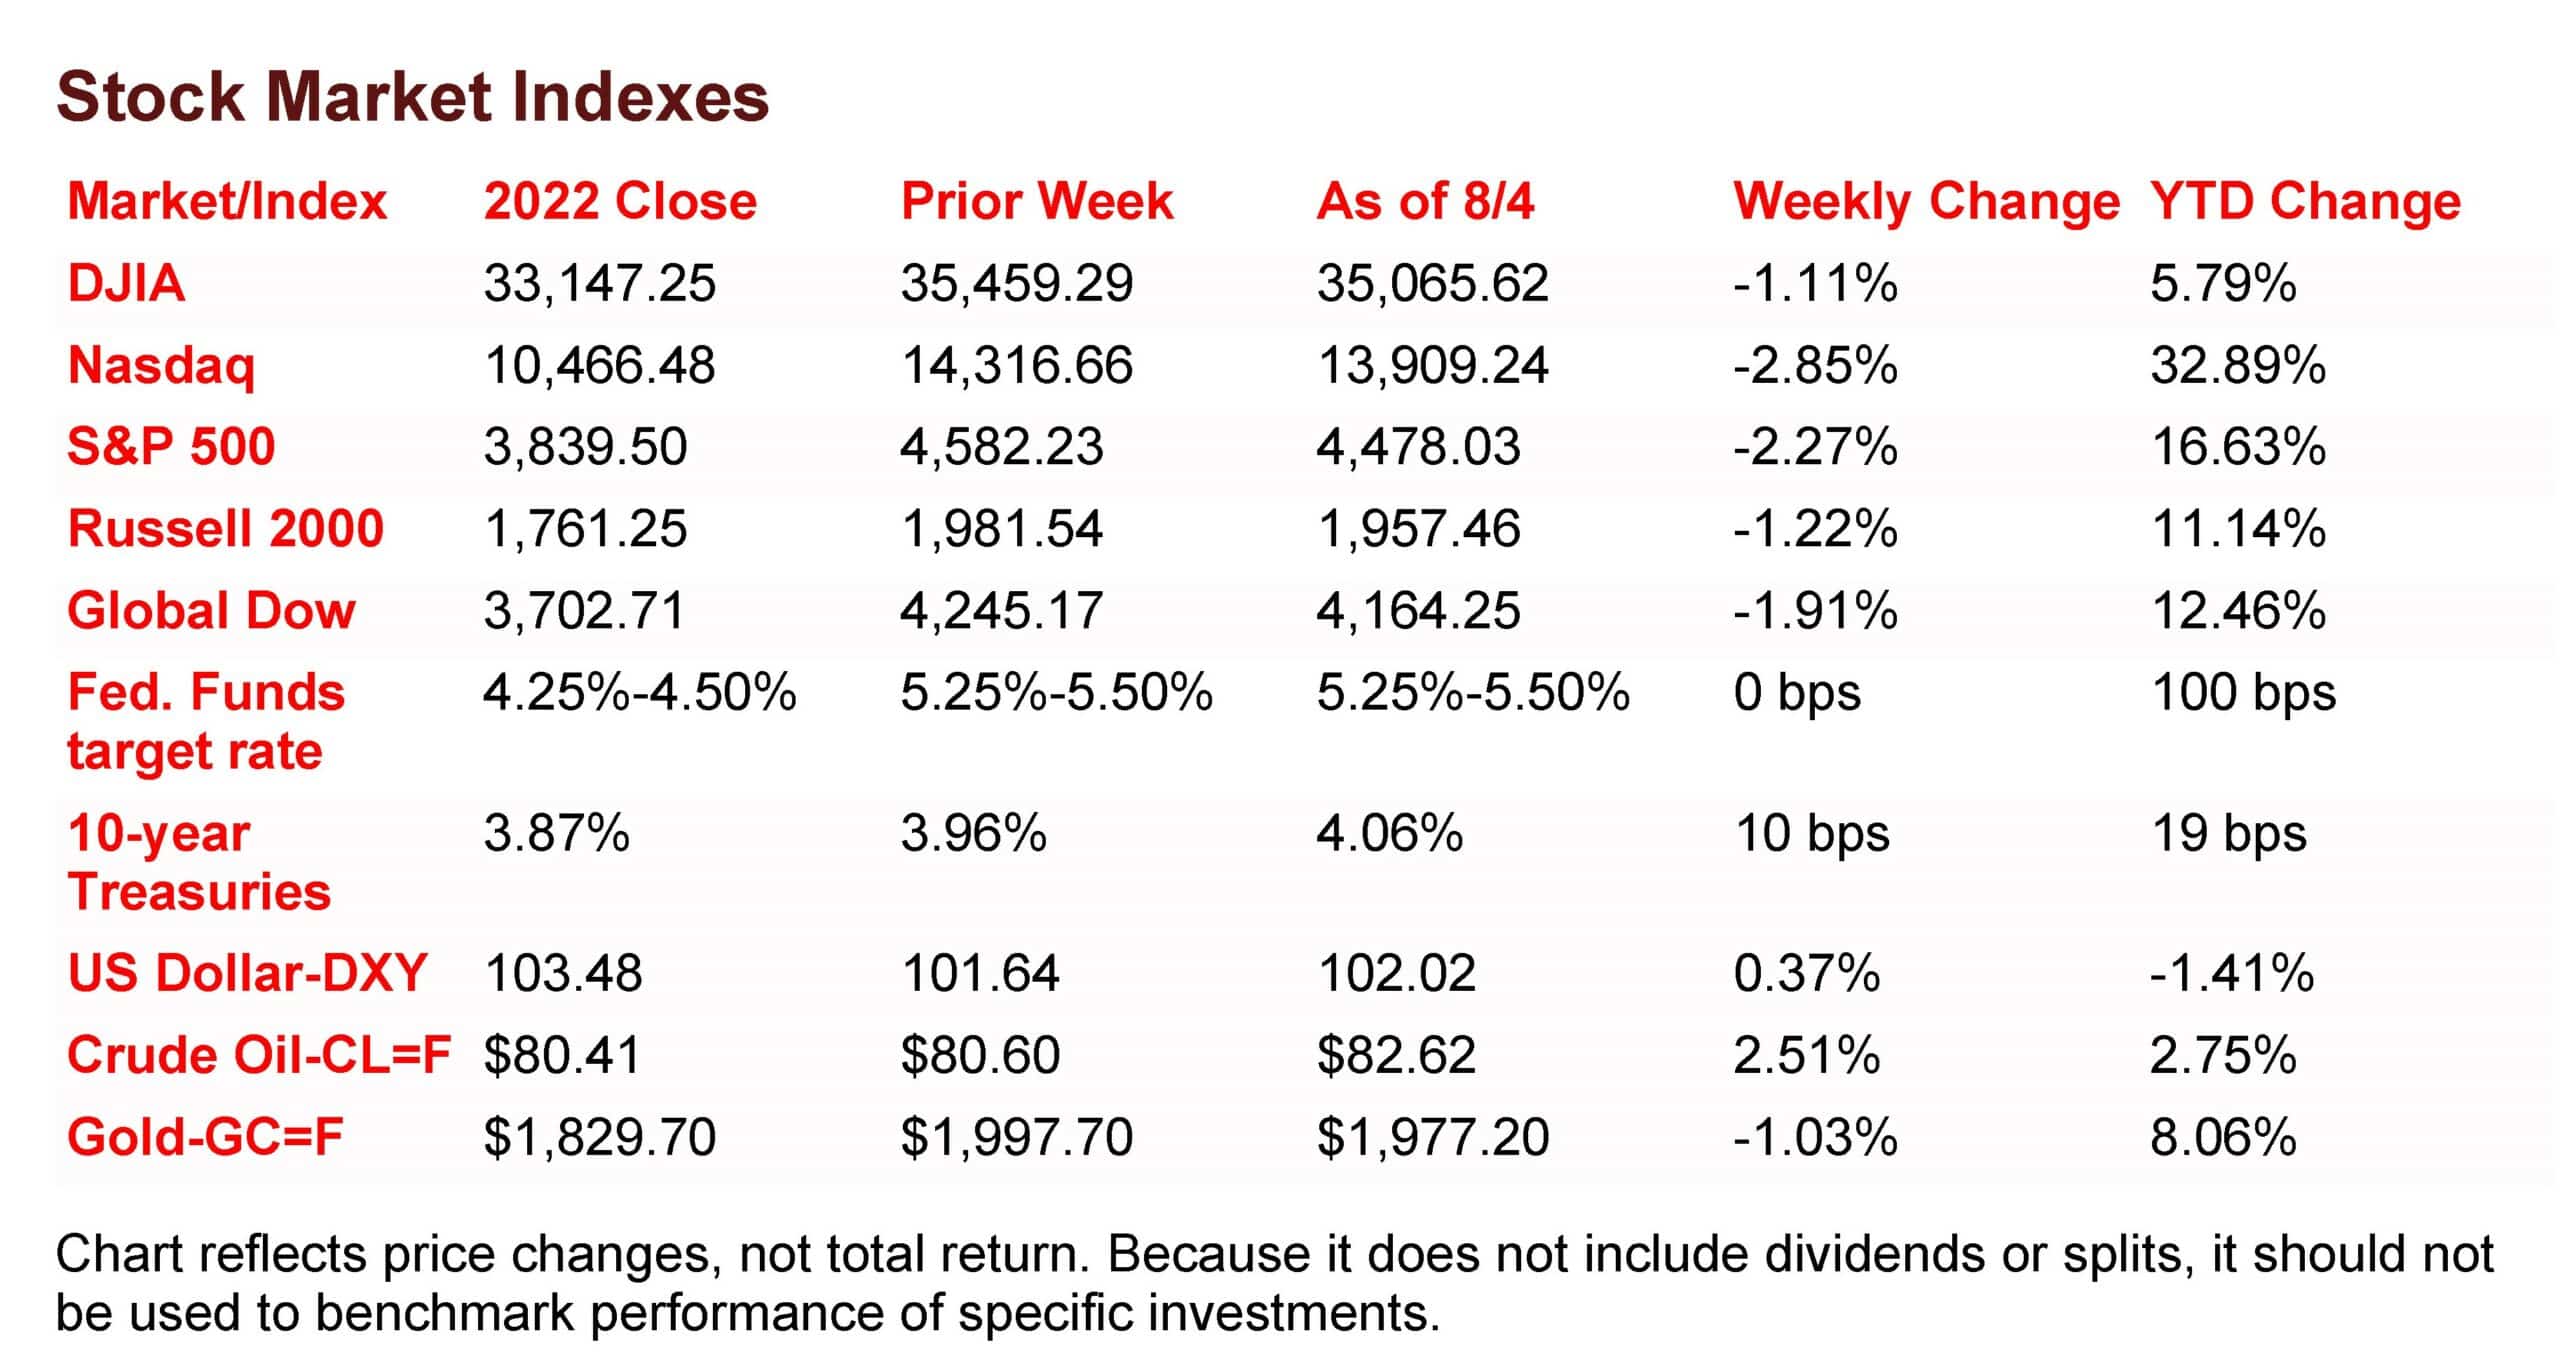
The Markets (as of market close August 4, 2023)
Stocks endured a losing week for the first time since early July. Each of the benchmark indexes listed here lost value, with the S&P 500 and the Nasdaq suffering the steepest weekly declines since March. Investors dealt with the downgrade of the US government’s credit rating and evidence that job growth may be slowing (see below). Corporate earnings have generally matched or beaten expectations, but a couple of bellwether tech and communications companies proffered disappointing earnings. Bond prices fell, pushing yields higher. The dollar rose higher, while gold prices slid lower. Crude oil prices increased for the sixth straight week, the longest streak in more than a year.
Wall Street closed out the month of July on an uptick, with each of the benchmark indexes listed here posting gains by the close of trading last Monday. The Russell 2000 advanced 1.1% to lead the indexes, followed by the Global Dow and the Dow (0.3%). The Nasdaq and the S&P 500 rose 0.2%. Ten-year Treasury yields closed the day where they began at 3.95%. Crude oil prices dipped marginally to settle at $81.65 per barrel. The dollar was flat, while gold prices fell 0.4%.
Stocks closed generally lower last Tuesday, with only the Dow (0.2%) advancing among the benchmark indexes listed here. The Global Dow fell 0.7%, followed by the Russell 2000 (-0.5%), the Nasdaq (-0.4%), and the S&P 500 (-0.3%). Most of the market sectors lost value, with only industrials and information technology gaining ground. Crude oil prices declined for the second straight session, falling 0.1% to $81.73 per barrel. The yield on 10-year Treasuries rose 9.2 basis points to 4.05%. The dollar gained traction, climbing 0.4%, while gold prices slid 1.4%.
The stock market took a tumble last Wednesday, with the Nasdaq experiencing its worst day in nearly five months. Investors may have been rattled after the credit rating firm Fitch downgraded the US government’s credit rating, which prompted an angry response from the White House and the Treasury Department. Fitch based its rating decision, in part, on the federal government’s growing levels of debt and political instability, including the January 6, 2021, attack on the Capitol. The Nasdaq slid 2.2%, followed by the Global Dow (-1.6%), the Russell 2000 and the S&P 500 (-1.4%), and the Dow (-1.0%). Yields on 10-year Treasuries rose 2.7 basis points to 4.07%. Crude oil prices continued to decline, dropping nearly 2.0% to $79.79 per barrel. The dollar rose 0.3%, while gold prices fell 0.4%.
Stocks declined for a third straight session last Thursday as investors continued to react to Fitch’s downgrade of US bonds. Ten-year Treasury yields spiked 11.1 basis points to 4.18%, the highest yield in nine months, while the dollar slipped lower, impacted by the credit downgrade. The Global Dow fell the furthest, down 0.4%, followed by the Russell 2000 and the S&P 500, which dipped 0.3%. The Dow lost 0.2%, while the Nasdaq essentially broke even, down 0.1%. Crude oil prices reversed course, gaining 2.8% to $81.71 per barrel. Gold prices declined 0.3%.
Wall Street closed lower last Friday to end a disappointing week for stocks. Only the Global Dow (0.4%) advanced among the benchmark indexes listed here. The S&P 500 slid 0.5%, followed by the Dow and the Nasdaq, which fell 0.4%. The small caps of the Russell 2000 dipped 0.2%. Ten-year Treasury yields, which had climbed for most of the week, fell nearly 13.0 basis points on the day. Crude oil prices rose 1.3%. The dollar declined 0.5%. Gold prices ended the day up 0.4%.
Last Week’s Economic News
Employment slowed in July, with the addition of 187,000 new jobs, well below the average monthly gain of 312,000 over the prior 12 months. In July, job gains occurred in health care, social assistance, financial activities, and wholesale trade. The unemployment rate ticked down 0.1 percentage point to 3.5%. The labor force participation rate and the employment-population ratio, at 62.6% and 60.4%, respectively, were virtually unchanged from the previous month. The total number of unemployed declined by 116,000 to 5.8 million. In July, average hourly earnings rose by $0.14, or 0.4%, to $33.74. Over the past 12 months, average hourly earnings have increased by 4.4%. The average workweek edged down by 0.1 hour to 34.3 hours in July. Employment gains for May and June were revised down by 25,000 and 24,000, respectively. With these revisions, employment in May and June combined was 49,000 lower than previously reported. The revisions for May and June, coupled with July’s figures, indicated job growth decelerated since the first quarter.
While the overall economy seems to be holding up despite rising interest rates, one sector that apparently has been impacted is manufacturing. According to the latest survey by S&P Global, US manufacturing declined further in July following a downturn in June. New orders contracted, leading firms to scale back their input buying, which caused a depletion in inventories. Purchasing managers also reported a rise in raw material costs, although selling prices remained stable as manufacturers tried to stay competitive and drive sales.
Unlike manufacturing, the services sector continued to expand in July, but at a slower pace than in the previous month. Business activity and new orders increased, although rising interest rates weighed on customer spending. Nevertheless, exports rose at a faster pace. Meanwhile, cost pressures for service providers softened, with prices rising at the slowest pace since December 2022.
According to the latest Job Openings and Labor Turnover report, the number of job openings in June, at 9.6 million, was little changed from the previous month. The number of hires decreased by 326,000 in June from May, while total separations fell by 288,000. Within separations, the number of quits (voluntary separations initiated by the employee) decreased by 295,000 in June, while the number of layoffs and discharges changed minimally from May.
The national average retail price for regular gasoline was $3.757 per gallon on July 31, $0.161 per gallon higher than the prior week’s price but $0.435 less than a year ago. Also, as of July 31, the East Coast price increased $0.158 to $3.646 per gallon; the Midwest price climbed $0.208 to $3.612 per gallon; the Gulf Coast price rose $0.173 to $3.416 per gallon; the Rocky Mountain price increased $0.118 to $3.873 per gallon; and the West Coast price advanced $0.077 to $4.616 per gallon.
For the week ended July 29, there were 227,000 new claims for unemployment insurance, an increase of 6,000 from the previous week’s level. According to the Department of Labor, the advance rate for insured unemployment claims for the week ended July 22 was 1.1%, unchanged from the previous week’s rate. The advance number of those receiving unemployment insurance benefits during the week ended July 22 was 1,700,000, an increase of 21,000 from the previous week’s level, which was revised down by 11,000. States and territories with the highest insured unemployment rates for the week ended July 15 were Puerto Rico (2.6%), New Jersey (2.5%), California (2.3%), Rhode Island (2.2%), Connecticut (2.1%), Massachusetts (2.0%), New York (1.8%), Oregon (1.8%), Pennsylvania (1.8%), and Minnesota (1.7%). The largest increases in initial claims for unemployment insurance for the week ended July 22 were in Vermont (+239), Oklahoma (+93), West Virginia (+41), the Virgin Islands (+23), and South Dakota (+8), while the largest decreases were in New York (-9,526), California (-5,310), Georgia (-2,853), Pennsylvania (-2,816), and South Carolina (-2,545).
Eye on the Week Ahead
Inflation data for July is available this week. The most recent Consumer Price Index showed prices rose 0.2% in June, while the 12-month increase was 3.0%. The Producer Price Index revealed prices inched up 0.1% in June and 0.1% over the last 12 months. Inflationary pressures are clearly waning, while the economy has shown resilience.
Key Dates/Data Releases
- 8/8: International trade in goods and services
- 8/10: Consumer Price Index, Treasury report
- 8/11: Producer Price Index
Scarlet Oak Financial Services can be reached at 800.871.1219 or contact us here. Click here to sign up for our weekly newsletter with the latest economic news.
Data sources:
Economic: Based on data from U.S. Bureau of Labor Statistics (unemployment, inflation);
U.S. Department of Commerce (GDP, corporate profits, retail sales, housing); S&P/Case-Shiller 20-City Composite Index (home prices); Institute for Supply Management (manufacturing/services). Performance: Based on data reported in WSJ Market Data Center (indexes); U.S. Treasury (Treasury yields); U.S. Energy Information Administration/Bloomberg.com Market Data (oil spot price, WTI, Cushing, OK); www.goldprice.org (spot gold/silver); Oanda/FX Street (currency exchange rates).
News items are based on reports from multiple commonly available international news sources (i.e., wire services) and are independently verified when necessary with secondary sources such as government agencies, corporate press releases, or trade organizations. All information is based on sources deemed reliable, but no warranty or guarantee is made as to its accuracy or completeness. Neither the information nor any opinion expressed herein constitutes a solicitation for the purchase or sale of any securities, and should not be relied on as financial advice. Forecasts are based on current conditions, subject to change, and may not come to pass. U.S. Treasury securities are guaranteed by the federal government as to the timely payment of principal and interest. The principal value of Treasury securities and other bonds fluctuates with market conditions. Bonds are subject to inflation, interest-rate, and credit risks. As interest rates rise, bond prices typically fall. A bond sold or redeemed prior to maturity may be subject to loss. Past performance is no guarantee of future results. All investing involves risk, including the potential loss of principal, and there can be no guarantee that any investing strategy will be successful.
The Dow Jones Industrial Average (DJIA) is a price-weighted index composed of 30 widely traded blue-chip U.S. common stocks. The S&P 500 is a market-cap weighted index composed of the common stocks of 500 largest, publicly traded companies in leading industries of the U.S. economy. The NASDAQ Composite Index is a market-value weighted index of all common stocks listed on the NASDAQ stock exchange. The Russell 2000 is a market-cap weighted index composed of 2,000 U.S. small-cap common stocks. The Global Dow is an equally weighted index of 150 widely traded blue-chip common stocks worldwide. The U.S. Dollar Index is a geometrically weighted index of the value of the U.S. dollar relative to six foreign currencies. Market indexes listed are unmanaged and are not available for direct investment.
Broadridge Investor Communication Solutions, Inc. prepared this material for use by Scarlet Oak Financial Services.
Broadridge Investor Communication Solutions, Inc. does not provide investment, tax, legal, or retirement advice or recommendations. The information presented here is not specific to any individual’s personal circumstances. To the extent that this material concerns tax matters, it is not intended or written to be used, and cannot be used, by a taxpayer for the purpose of avoiding penalties that may be imposed by law. Each taxpayer should seek independent advice from a tax professional based on individual circumstances. Scarlet Oak Financial Services provide these materials for general information and educational purposes based upon publicly available information from sources believed to be reliable — we cannot assure the accuracy or completeness of these materials. The information in these materials may change at any time and without notice.
