
Market Week October 2 2023
Market Recap:
Last week, the stock market showed mixed results. While the Nasdaq gained 0.5%, the S&P 500, the Russell 2000, and the Dow had slight increases ranging from 0.1% to 0.4%. However, there was a slump in stocks on Tuesday, and equities ended mostly lower on Friday. Meanwhile, bond prices fell, causing a rise in 10-year Treasury yields for the fourth consecutive week. The dollar strengthened while gold prices dropped. Crude oil prices ticked higher after a slip the previous week. The Federal Reserve predicts higher interest rates in the long term despite a decrease in inflation.
The US economy grew at an annualized rate of 2.1% in Q2, with personal consumption expenditures rising 0.8%. Residential fixed investment declined 2.2%, while nonresidential fixed investment jumped 7.4%. Sales of single-family homes in August fell 8.7% from the previous month, while durable goods orders increased 0.2% in August. The advance report on the international trade in goods deficit for August was $6.6 billion. For the week ended September 23, there were 204,000 new claims for unemployment insurance. Hourly earnings continued to increase, rising 4.3% since August 2022.
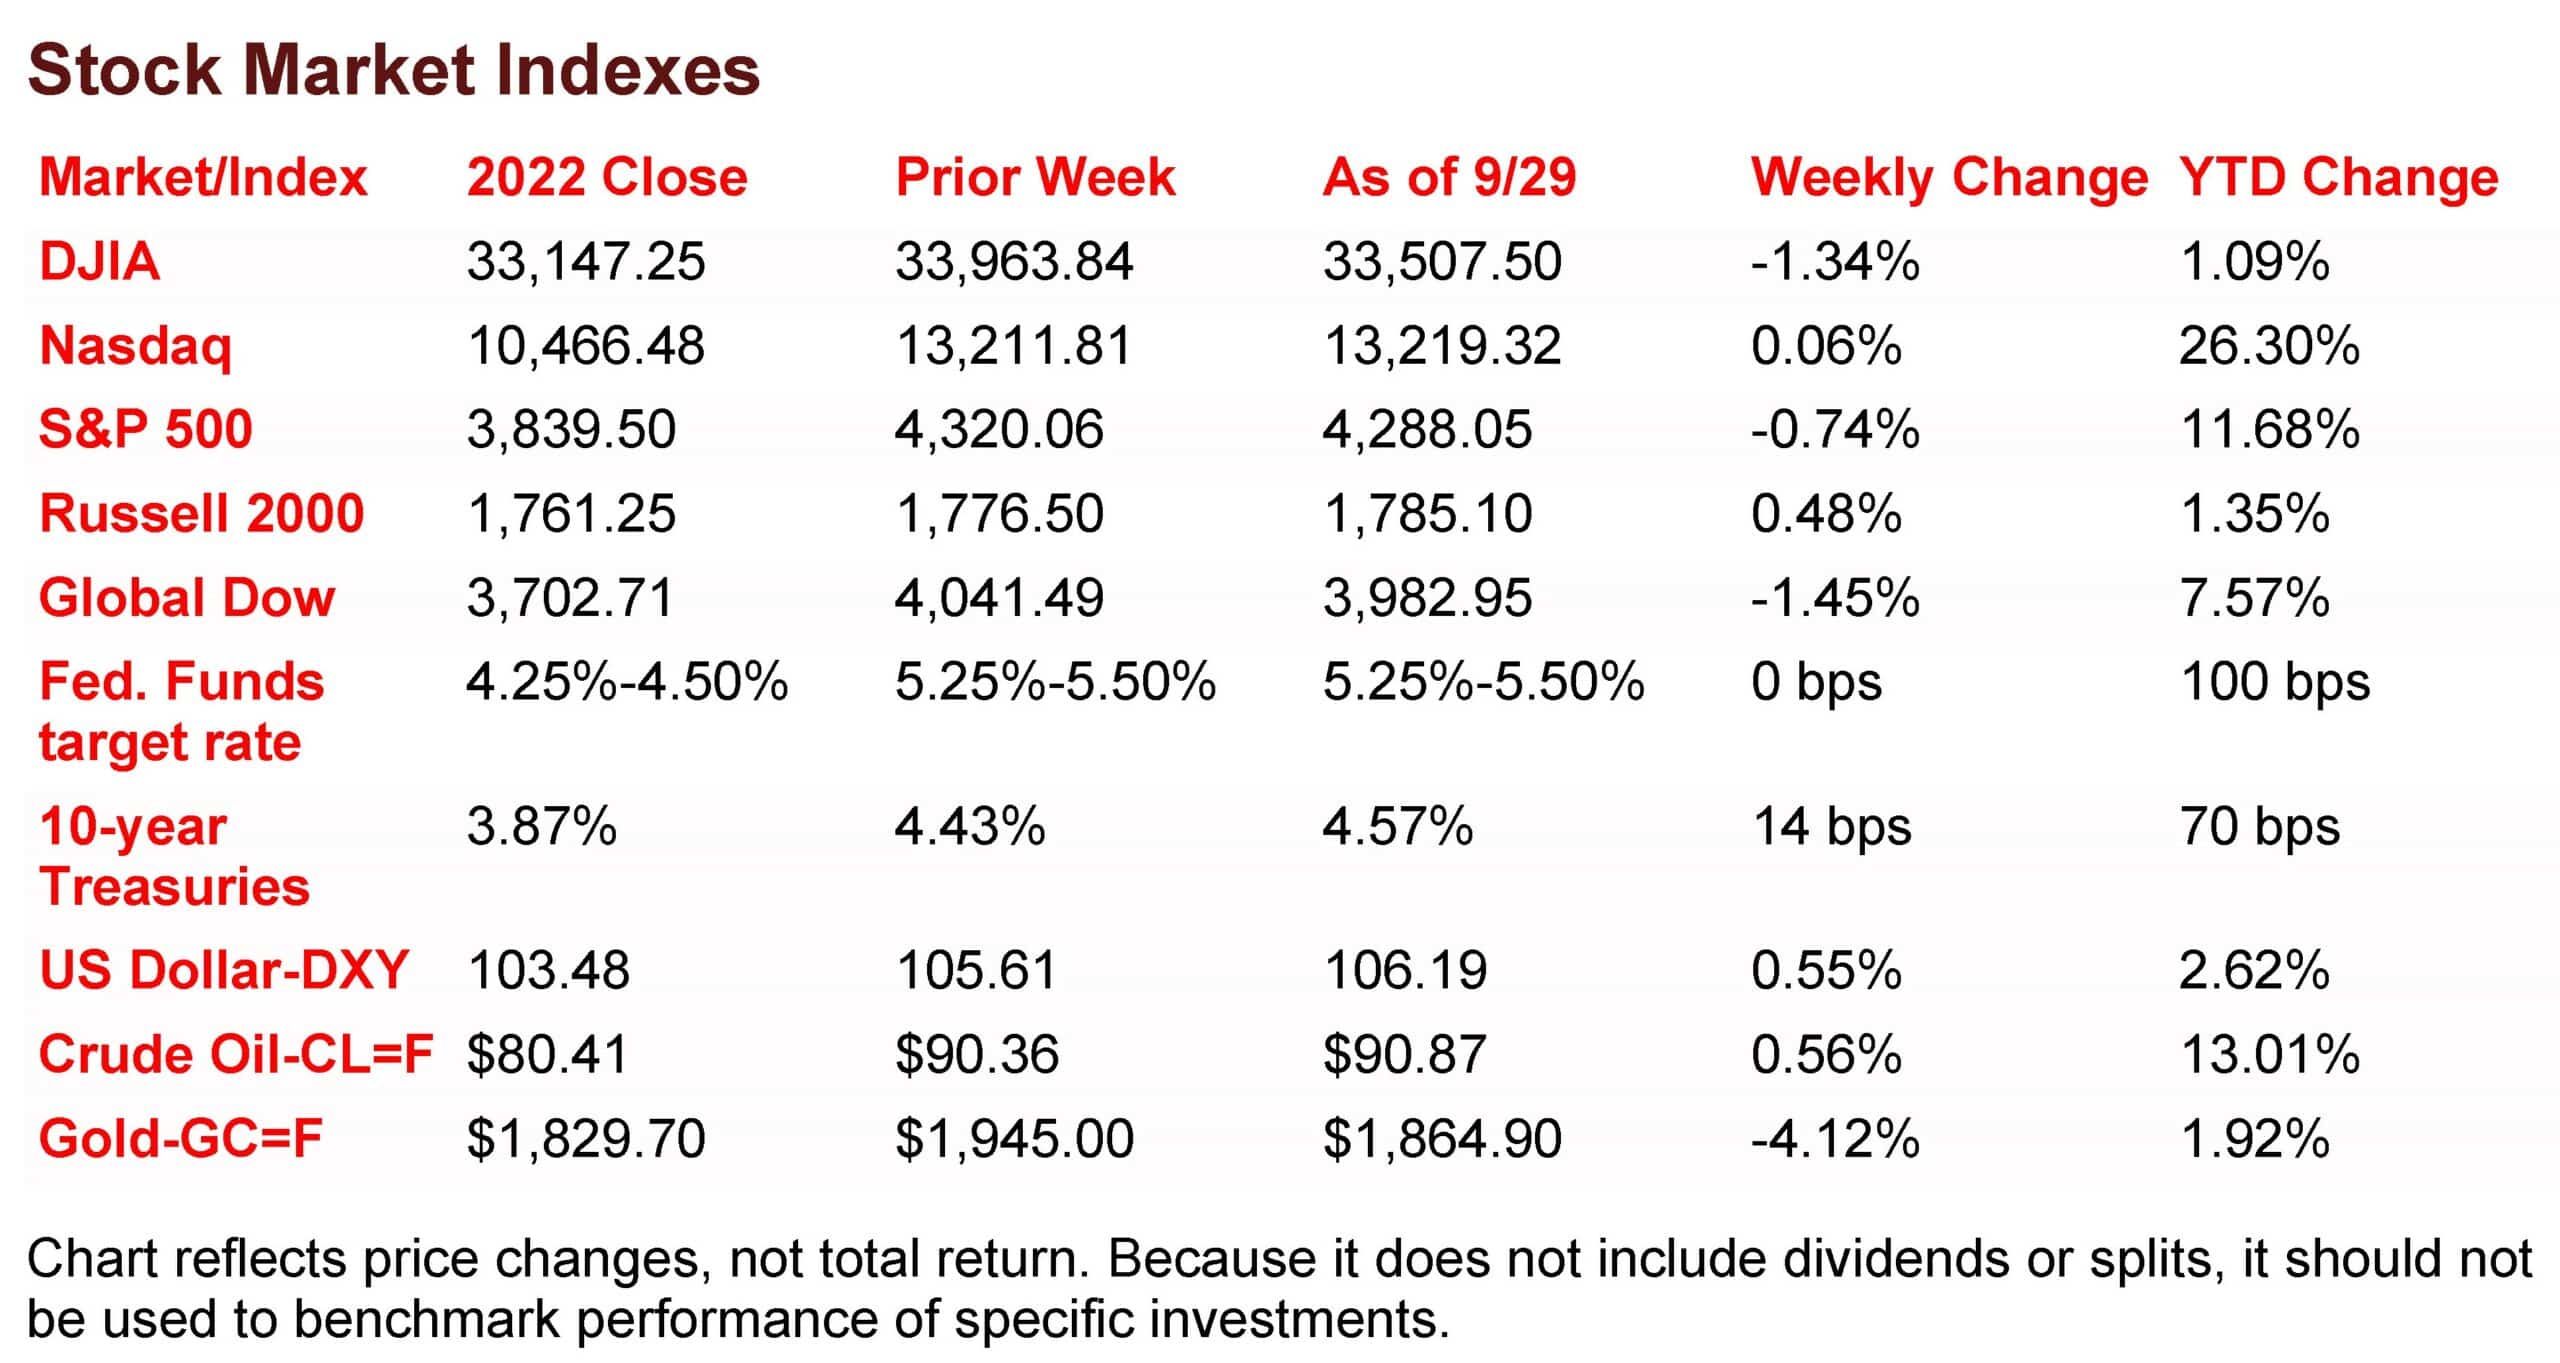
The Markets (as of market close September 29, 2023)
The market returned mixed results last week, with the Russell 2000 and the Nasdaq advancing, while the Global Dow, the Dow, and the S&P 500 shed value. Bond prices fell, pushing 10-year Treasury yields up for the fourth straight week. The dollar advanced, while gold prices dropped. Crude oil prices ticked higher after slipping the prior week. Overall, another lackluster September came to a close with the Federal Reserve projecting higher interest rates for longer despite data that shows inflation is cooling.
Stocks rebounded last Monday following the prior week’s slump. Other than the Global Dow (-0.3%), each of the benchmark indexes listed here gained ground, led by the Nasdaq (0.5%), followed by the S&P 500 and the Russell 2000 (0.4%), and the Dow (0.1%). Energy, materials, and consumer discretionary led the sectors. Ten-year Treasury yields added 10.4 basis points to close at 4.54%, the highest level since 2007. Crude oil prices were flat, settling at about $89.95 per barrel. The dollar rose 0.4%, while gold prices fell 0.6%.
Wall Street couldn’t maintain momentum from the day before as stocks tumbled last Tuesday. The Nasdaq slid 1.6%, the S&P 500 lost 1.5%, the Russell 2000 declined 1.3%, the Dow dipped 1.1%, and the Global Dow fell 1.0%. For perspective, the S&P 500 closed at its lowest level since early June, while the Dow had its largest single-day percentage decline since March. Ten-year Treasury yields, on the other hand, reached new highs after closing at 4.55%. Crude oil prices, which hovered around $90.59 per barrel, remain near 10-month highs. The stock market downturn extended to a fourth week, impacted by the continued hawkish Fed monetary policy, rising crude oil and gasoline prices, and stubborn inflation. September’s decline in consumer confidence has not helped matters. And to add to investor angst, the Federal Government is facing a shutdown.
The Dow (-0.2%) and the Global Dow (-0.3%) slid lower last Wednesday, while the Russell 2000 (1.0%) and the Nasdaq (0.2%) advanced. The large caps of the S&P 500 ended the day where they began. Ten-year Treasury yields, pushed higher by sagging bond prices, added 6.8 basis points to close at 4.62%, the highest level since 2007. Crude oil prices jumped 3.6%, settling at $93.63 per barrel. The dollar rallied to its highest level in nearly a year, while gold prices dipped lower.
Stocks maintained momentum from the previous day, climbing higher last Thursday. Each of the benchmark indexes listed here posted gains, led by the Russell 2000 (0.9%), followed by the Nasdaq (0.8%), the S&P 500 (0.6%), and the Dow and the Global Dow (0.4%). Ten-year Treasury yields declined 2.9 basis points as bond prices inched higher. The 10-year Treasury yield settled at 4.59% on Thursday. Crude oil prices gave back some of last Wednesday’s gains, falling 2.1% to $91.76 per barrel. The dollar and gold prices dipped lower.
Equities ended mostly lower last Friday, with a push from megacaps lifting the Nasdaq up 0.1%. The Russell 2000 and the Dow lost 0.5%, while the Global Dow and the S&P 500 slid 0.3%. Ten-year Treasury yields dipped 2.4 basis points to 4.57%. Crude oil prices fell nearly 1.0% to settle at $90.87 per barrel. The dollar and gold prices declined.
Last Week’s Economic News
The economy grew at an annualized rate of 2.1% in the second quarter according to the third and final estimate of gross domestic product. GDP accelerated at a rate of 2.2% in the first quarter. The personal consumption expenditures (PCE) price index increased 2.5%. Excluding food and energy prices, the PCE price index increased 3.7%. Consumer spending, as measured by the personal consumption expenditures index, rose 0.8%. Spending on goods increased 0.5%, while spending on services climbed 1.0%. Residential fixed investment declined 2.2%, while nonresidential (business) fixed investment jumped 7.4%. Exports fell 9.3%. Imports, which are a negative in the calculation of GDP, declined 7.6%.
Prices consumers paid for goods and services, as measured by the personal consumption expenditures (PCE) price index, rose 0.4% in August following a 0.2% increase in July. Excluding food and energy, prices inched up 0.1%. Energy prices advanced 6.1% in August, accounting for a significant portion of the overall increase in consumer prices. Over the 12 months ended in August, the PCE price index rose 3.5%, 0.1 percentage point higher than the 12-month estimate for the period ended in July. The August 12-month increase in prices excluding food and energy increased 3.9%, down from 4.3% for the 12 months ended in July. Also in August, personal income increased 0.4%, while disposable personal income advanced 0.2%. Consumer spending, as measured by the personal consumption expenditures (PCE) index, increased 0.4% in August, down from the July estimate of 0.9%.
Sales of single-family homes in August fell 8.7% from the previous month but were 5.8% above the August 2022 estimate. The median sales price of new houses sold in August was $430,300, down from $436,600 in July. The average sales price was $514,000, up from the July estimate of $507,900. The estimate of new homes for sale at the end of August sat at a 7.8-month supply at the current sales pace.
Durable goods orders increased 0.2% in August after falling 5.6% in July. Excluding transportation, new orders increased 0.4%. Excluding defense, new orders decreased 0.7%. Machinery, up four of the last five months, led the increase after advancing 0.5%. New orders for defense capital goods played a large part in the overall increase in August. New orders for nondefense capital goods in August decreased 2.9%. New orders for defense capital goods in August increased 18.6%.
The advance report on the international trade in goods (excluding services) deficit for August was $6.6 billion, or 7.3%, lower than the July estimate. Exports increased $3.6 billion, or 2.2%, while imports decreased $3.1 billion, or 1.2%. Since August 2022, exports declined 5.9%, while imports dropped 5.2%.
The national average retail price for regular gasoline was $3.837 per gallon on September 25, $0.041 per gallon lower than the prior week’s price but $0.126 more than a year ago. Also, as of September 25, the East Coast price decreased $0.056 to $3.598 per gallon; the Midwest price fell $0.071 to $3.639 per gallon; the Gulf Coast price dropped $0.080 to $3.351 per gallon; the Rocky Mountain price declined $0.075 to $3.996 per gallon; and the West Coast price advanced $0.095 to $5.258 per gallon.
For the week ended September 23, there were 204,000 new claims for unemployment insurance, an increase of 2,000 from the previous week’s level, which was revised up by 1,000. According to the Department of Labor, the advance rate for insured unemployment claims for the week ended September 16 was 1.1%, unchanged from the previous week’s rate. The advance number of those receiving unemployment insurance benefits during the week ended September 16 was 1,670,000, an increase of 12,000 from the previous week’s level, which was revised down by 4,000. States and territories with the highest insured unemployment rates for the week ended September 9 were Hawaii (2.5%), New Jersey (2.3%), California (2.1%), New York (1.8%), Puerto Rico (1.8%), Massachusetts (1.6%), Rhode Island (1.6%), Nevada (1.5%), Oregon (1.5%), and Washington (1.5%). The largest increases in initial claims for unemployment insurance for the week ended September 16 were in Georgia (+1,539), New York (+1,332), South Carolina (+1,103), Texas (+987), and Oregon (+557), while the largest decreases were in Indiana (-2,761), California (-1,498), Virginia (-631), Iowa (-558), and Kentucky (-375).
Eye on the Week Ahead
The employment figures for September are out this week. The labor sector has been strong throughout the year, although the pace of new jobs added has slowed somewhat over the past few months. Hourly earnings continued to increase, rising 4.3% since August 2022.
Key Dates/Data Releases
- 10/2: S&P Global Manufacturing PMI
- 10/3: JOLTS
- 10/4: S&P Global Services PMI
- 10/5: International trade in goods and services
- 10/6: Employment situation
Scarlet Oak Financial Services can be reached at 800.871.1219 or contact us here. Click here to sign up for our weekly newsletter with the latest economic news.
Data sources:
Economic: Based on data from U.S. Bureau of Labor Statistics (unemployment, inflation); U.S. Department of Commerce (GDP, corporate profits, retail sales, housing); S&P/Case-Shiller 20-City Composite Index (home prices); Institute for Supply Management (manufacturing/services). Performance: Based on data reported in WSJ Market Data Center (indexes); U.S. Treasury (Treasury yields); U.S. Energy Information Administration/Bloomberg.com Market Data (oil spot price, WTI, Cushing, OK); www.goldprice.org (spot gold/silver); Oanda/FX Street (currency exchange rates). News items are based on reports from multiple commonly available international news sources (i.e., wire services) and are independently verified when necessary with secondary sources such as government agencies, corporate press releases, or trade organizations.
All information is based on sources deemed reliable, but no warranty or guarantee is made as to its accuracy or completeness. Neither the information nor any opinion expressed herein constitutes a solicitation for the purchase or sale of any securities, and should not be relied on as financial advice. Forecasts are based on current conditions, subject to change, and may not come to pass. U.S. Treasury securities are guaranteed by the federal government as to the timely payment of principal and interest. The principal value of Treasury securities and other bonds fluctuates with market conditions. Bonds are subject to inflation, interest-rate, and credit risks. As interest rates rise, bond prices typically fall. A bond sold or redeemed prior to maturity may be subject to loss. Past performance is no guarantee of future results. All investing involves risk, including the potential loss of principal, and there can be no guarantee that any investing strategy will be successful.
The Dow Jones Industrial Average (DJIA) is a price-weighted index composed of 30 widely traded blue-chip U.S. common stocks. The S&P 500 is a market-cap weighted index composed of the common stocks of 500 largest, publicly traded companies in leading industries of the U.S. economy. The NASDAQ Composite Index is a market-value weighted index of all common stocks listed on the NASDAQ stock exchange. The Russell 2000 is a market-cap weighted index composed of 2,000 U.S. small-cap common stocks. The Global Dow is an equally weighted index of 150 widely traded blue-chip common stocks worldwide. The U.S. Dollar Index is a geometrically weighted index of the value of the U.S. dollar relative to six foreign currencies. Market indexes listed are unmanaged and are not available for direct investment.
Broadridge Investor Communication Solutions, Inc. prepared this material for use by Scarlet Oak Financial Services.
Broadridge Investor Communication Solutions, Inc. does not provide investment, tax, legal, or retirement advice or recommendations. The information presented here is not specific to any individual’s personal circumstances. To the extent that this material concerns tax matters, it is not intended or written to be used, and cannot be used, by a taxpayer for the purpose of avoiding penalties that may be imposed by law. Each taxpayer should seek independent advice from a tax professional based on individual circumstances. Scarlet Oak Financial Services provide these materials for general information and educational purposes based upon publicly available information from sources believed to be reliable — we cannot assure the accuracy or completeness of these materials. The information in these materials may change at any time and without notice.
