
CONSUMER SENTIMENT HITS A 2-YEAR LOW
Analysts surveyed by MarketWatch thought the University of Michigan’s preliminary January consumer sentiment index would display a reading of 97.5. Instead, it came in at just 90.7, dropping 7.6 points from its final December mark to its lowest level since October 2016. Richard Curtin, the economist who has long overseen the university’s survey, attributed the slip not only to households reacting to the partial federal government shutdown, but also to “the impact of tariffs, instabilities in financial markets, the global slowdown and the lack of clarity about monetary policies.”1
HINTS OF A THAW IN U.S.-CHINA TRADE NEGOTIATIONS
Investors were encouraged Friday by news that China had offered a plan to reduce its trade surplus with the U.S. from more than $320 billion to $0 by 2024. The concept, first presented to U.S. trade officials earlier this month, would involve China buying $45 billion more in U.S. goods this year and incrementally more in the five years to follow. Whether the strategy would work is questionable, as America’s strong ongoing demand for Chinese products is arguably the biggest factor in the trade imbalance. Nevertheless, stocks rallied after the news. A day earlier, a Wall Street Journal story noted that U.S. officials were considering easing current tariffs on Chinese imports in exchange for such concessions.2,3
OIL RISES 4.3% IN A WEEK
As a result of that gain, WTI crude was worth $53.80 per barrel on the New York Mercantile Exchange at Friday’s close. The latest developments in U.S.-China trade negotiations and the sharpest weekly pullback in the U.S. rig count since 2016 helped to push the price higher.3
AN EARLY EARNINGS SCORECARD
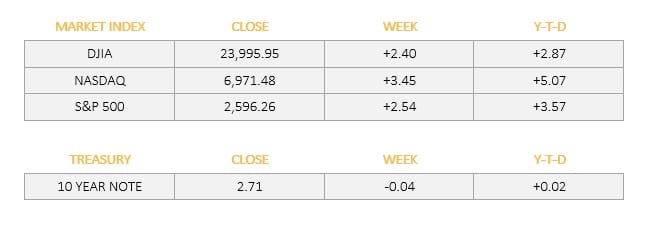
Through Friday, 11% of S&P 500 firms had reported Q4 results. Seventy-six percent of those companies reported actual earnings-per-share exceeding projections, and 56% beat revenue estimates. As the trading week ended, stock market analytics firm FactSet projected year-over-year earnings growth of 10.6% for all S&P constituents for Q4. While this would represent a fifth consecutive quarter of double-digit improvement, such an advance would be the smallest since Q4 2017. Last week, all three major U.S. equity indices rose; you will find their weekly and YTD performances below, along with last Friday’s settlements.4
THIS WEEK
- U.S. financial markets are closed Monday as the nation observes Martin Luther King, Jr. Day.
- Capital One, Fifth Third, GATX, Halliburton, IBM, Johnson & Johnson, TD Ameritrade, Travelers Companies, UBS Group, Union Bank, and Zions Bancorp report earnings Tuesday, and investors also consider December existing home sales figures.
- Wednesday’s earnings parade includes Abbott Labs, Comcast, Ford Motor Co., Kimberly-Clark, Northern Trust, Procter & Gamble, and Texas Instruments.
- Firms reporting Thursday include Alaska Air, American Airlines, Bristol-Myers, Discover, Freeport McMoRan, Intel, JetBlue, Norfolk Southern, Starbucks, Union Pacific, and Western Digital; beyond the earnings news, a new initial claims report and the Conference Board’s latest index of leading indicators emerge.
- AbbVie, Colgate-Palmolive, D.R. Horton, and NextEra Energy announce earnings Friday; data on December new home sales and durable goods orders may be released if the partial federal government shutdown ends.
Sources: wsj.com, treasury.gov – 1/18/195,6,7
Indices are unmanaged, do not incur fees or expenses, and cannot be invested into directly. These returns do not include dividends. Weekly and year-to-date market index returns are expressed as percentages. 10-year Treasury note yield = projected return on investment, expressed as a percentage, on the U.S. government’s 10-year bond. Weekly and year-to-date 10-year Treasury note yield differences are expressed in basis points.
This material was prepared by MarketingPro, Inc., and does not necessarily represent the views of the presenting party, nor their affiliates. The information herein has been derived from sources believed to be accurate. Please note – investing involves risk, and past performance is no guarantee of future results. Investments will fluctuate and when redeemed may be worth more or less than when originally invested. This information should not be construed as investment, tax or legal advice and may not be relied on for the purpose of avoiding any Federal tax penalty. This is neither a solicitation nor recommendation to purchase or sell any investment or insurance product or service, and should not be relied upon as such. All market indices discussed are unmanaged and are not illustrative of any particular investment. Indices do not incur management fees, costs, or expenses. Investors cannot invest directly in indices. All economic and performance data is historical and not indicative of future results. The Dow Jones Industrial Average is a price-weighted index of 30 actively traded blue-chip stocks. The NASDAQ Composite Index is a market-weighted index of all over-the-counter common stocks traded on the National Association of Securities Dealers Automated Quotation System. The Standard & Poor’s 500 (S&P 500) is a market-cap weighted index composed of the common stocks of 500 leading companies in leading industries of the U.S. economy. NYSE Group, Inc. (NYSE:NYX) operates two securities exchanges: the New York Stock Exchange (the “NYSE”) and NYSE Arca (formerly known as the Archipelago Exchange, or ArcaEx®, and the Pacific Exchange). NYSE Group is a leading provider of securities listing, trading and market data products and services. The New York Mercantile Exchange, Inc. (NYMEX) is the world’s largest physical commodity futures exchange and the preeminent trading forum for energy and precious metals, with trading conducted through two divisions – the NYMEX Division, home to the energy, platinum, and palladium markets, and the COMEX Division, on which all other metals trade. Additional risks are associated with international investing, such as currency fluctuations, political and economic instability and differences in accounting standards. This material represents an assessment of the market environment at a specific point in time and is not intended to be a forecast of future events, or a guarantee of future results. MarketingPro, Inc. is not affiliated with any person or firm that may be providing this information to you. The publisher is not engaged in rendering legal, accounting or other professional services. If assistance is needed, the reader is advised to engage the services of a competent professional.
Advisory Services offered through Capital Asset Advisory Services, LLC., a Registered Investment Advisor.
CITATIONS:
1 – marketwatch.com/story/consumer-sentiment-in-january-plunges-to-lowest-level-since-trump-elected-2019-01-18 [1/18/19]
2 – bloomberg.com/news/articles/2019-01-18/china-is-said-to-offer-path-to-eliminate-u-s-trade-imbalance [1/18/19]
3 – marketwatch.com/story/oil-prices-push-higher-on-hopes-for-us-china-trade-progress-2019-01-18 [1/18/19]
4 – insight.factset.com/earnings-season-update-january-18-2019 [1/18/19]
5 – markets.wsj.com [1/18/19]
6 – treasury.gov/resource-center/data-chart-center/interest-rates/Pages/TextView.aspx?data=yield [1/18/19]
7 – treasury.gov/resource-center/data-chart-center/interest-rates/Pages/TextView.aspx?data=yieldAll [1/18/19]
